
Sept 12. “I’m prayed up…”
In: Eurodollar Options
Sept 11. What’s the frequency Kenneth?
In: Eurodollar Options
Sept 10. Higher wages, higher rates (over the short term)
In: Eurodollar Options
Sept 9. Lehman’s Shadows
The two year note closed at a new high this week of 2.703%. The last time it was this high was just over ten years ago in July 2008 (in June 2007 the yield was 5.08%).
We’re rapidly approaching the 10-year Anniversary of the 2008 financial crisis. Exactly one decade ago to the day (September 7, 2008), Fannie Mae and Freddie Mac were placed into government receivership. And for at least a decade, there has been nothing more than talk of reforming the government-sponsored-enterprises. Credit Bubble Bulletin, Doug Noland
Global debt as a % of the world’s GDP was 286% when we were watching pictures of Lehman employees carrying out their boxes. Today it’s 318%. David Ader
Lehman Brothers filed for Chapter 11 bankruptcy on September 15, 2008. And of course, this week is the 17th anniversary of the 9/11 attack.
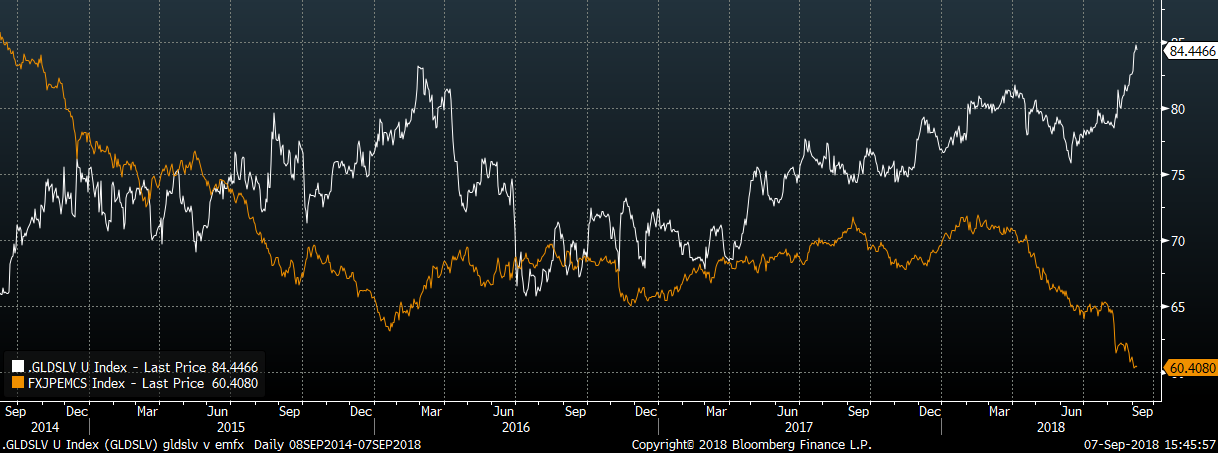
In late 2008 the gold/silver ratio exploded from around 53 to 84 as the financial crisis cascaded. By late 2010 it was falling back hard, and in 2011 reached a bottom in the low 30’s. On Friday the gold/silver ratio closed at 84.4, equaling the peak set during the crisis.
By most measures, the US economy is doing quite well. Friday’s employment report is another piece of evidence that the labor market is robust, with yoy wage gains accelerating to 2.9%. Manufacturing ISM was the strongest since 2004 and Service ISM was solid as well. At least five Fed officials last week said that continued gradual rate hikes continue to be warranted. Tim Duy sums it up this way: “Bottom line: Fed still hasn’t found a reason to pause. The US data isn’t really giving one. And don’t expect emerging market turmoil to factor much into the Fed’s decisions – until the problem threatens to wash up on US shores, it will fall into the general category of ‘risks we talk about but don’t act on.’” Why would a stress measure like gold/silver be all the way back at crisis level highs if the future is so bright?
We all know that the Great Financial Crisis was brought on by extreme mortgage debt encouraged by lax lending standards and supported by exotic sliced and diced financing vehicles with inflated ratings that were pedaled to the global investment community. The Fed’s tightening cycle from 2004 to 2006 eventually caught up to slimly capitalized adjustable rate mortgages
So let’s look at outstanding debt levels from the Fed’s Z.1 report. At the end of 2008, Household mortgage debt was $10.608 trillion. As of Q1 2018, it’s $10.144 T. It has DECLINED!! As a result, homeowner’s equity as a percentage of household real estate is back to pre-crisis levels of 60% as low rates have helped to expand home values. That’s good. Consumer credit in 2008 was $2.644T vs $3.873T now, an increase of $1.524T. Nearly $1T of that increase is in student debt. So, aside from student debt, the Household sector is in good shape, corroborated by the HH Financial Obligation Ratio (link at bottom) which has been stable for the last several years, now at 15.75%. In Q4 2007 it peaked at 18.14%.
Corporate debt has expanded from $6.57T in 2008 to a record $9.057T now, a pretty big increase considering that capex has been weak; obviously share buybacks have been part of the reason for growth. The change in state and local government debt has been tame, moving from $2.978T to $3.065T, an increase of only 3% in ten years! However, FEDERAL Govt debt has exploded from $7.377T to $17.085T. Federal gov’t current tax receipts have gone from a peak level in 2007 of $1.6T annually to just over $2.0T annually in 2017. It doesn’t take a genius to see that private debts have been shuffled to the balance sheet of the federal gov’t, and that tax receipts are becoming a smaller percentage of the outstanding debt. In a way, the HH sector has been the most financially savvy and conservative since the crisis. It’s no secret that investment grade corporate debt is now bunching up at the lower tiers just above junk. When analysts talk about an economic “sugar high” that has been juiced by the government, even a simple review of the data above makes the case. Can growth dig us out? That is, of course, the hope.
But the above domestic debt review also makes several things pretty clear. First, the next crisis, if and when it comes, isn’t going to be a result of the HH sector. Second, it’s obvious that the Fed and the administration are on a collision course if the Fed keeps hiking. Third, if the markets become less hospitable to US debt, then Houston, we have a problem.
The Fed’s goal of 2% inflation to support normalization efforts runs squarely into the Federal budget, which is anything but normal. So, as data like Friday’s annualized wage growth of 2.9% is released (which bolsters the Fed’s case for continued gradual rate hikes) the curve is under flattening pressure. In Eurodollars, the red pack to green pack (2nd year forward to 3rd year forward) has traded a couple of basis points on either side of zero since June. When the September’18 contract expires next week, the red pack will begin with the December’19 contract and the green pack will start with December’20. That ‘new’ pack spread settled -2.5 bps on Friday. The point is that the Eurodollar curve currently forecasts a slowdown next year, buying into the ‘sugar-high’ scenario.
In the old days it wasn’t uncommon to hear terms like “crowding out” which referred to voracious Federal Gov’t borrowing needs pushing private sector borrowers to the back of the line. Recently, it seems as if federal debt offerings are effortlessly absorbed regardless of size. This week brings auctions of 3’s 10’s and 30’s, that are raising $49 billion in new cash. The strength of the US dollar, which tends to depress commodities, is perhaps seen as deflationary, supporting a bid for long dated treasuries. But at some point sheer supply may become an issue. Last week the NY Fed chief Williams said that long yields were depressed, in part, because of the Fed’s buying. That dynamic could also work in reverse.
In the years leading up to the GFC, lending standards and regulations were relaxed; there was simply too much debt without enough equity cushion. For emerging market economies that have borrowed in dollars, the ‘equity cushion’ is in the form of domestic currency vs the USD. That cushion is evaporating. Is the gold/silver ratio telegraphing the problem? The chart below seems to reflect growing concern. In the early days of the GFC, subprime concerns were shrugged off. The same is occurring now with emerging markets.
Chart of Gold/silver ratio in white, vs JPM EMFX index.
Sept 7. Payrolls – focus on wages
–Employment report this morning with NFP expected 193k, rate of 3.8% and yoy average hourly earnings +2.7%. From the NY Fed’s Williams yesterday (BBG): “The fact that wages haven’t grown a lot faster is a sign that this economy still has room to run,” he said, adding that as a result, “we don’t feel the need to raise interest rates more quickly than otherwise.” Another article noted that Williams appears to have shifted to a slightly more dovish stance, downplaying inflation concerns in his comments. Little reaction in the market though 5/30 treasury spread edged to a slight new high at 30.7 bps. Overall, yields fell 2-3 bps yesterday with tens -2.3 to 287.7.
Sept 6. Domestic data isn’t much of a catalyst
-Little change in US rates yesterday in spite of equity market sector rebalancing. Curve edged very slightly steeper. NY Fang index was down 2.7% yesterday and Nasdaq -1.19%, but outside of tech, damage was minimal with DJIA closing higher on the day. Employment report tomorrow, but that data, which used to be the big report of the month, is now little more than a footnote. We know the labor market is strong. Policy is caught between a solid domestic economy and increasing fissures internationally, which may or may not splinter into the US, and I mean that both in terms of Fed policy and the administration’s in general. Markets don’t seem to care: Eurodollar premium was hammered yesterday. Heavy selling in Oct 9737^ at 6.5 (settled there with new open int of 25k). 0EZ 9725c were sold at 5.0 to 5.5 in size of 50k which were new sales (settled 5.25 vs 9702.5). One week ago Monday (Aug 27), EDZ 9737 straddle was 14.5 vs 12.0 settle yesterday. 0EZ 9700 straddle went from 26.5 to 24.5. At the end of May market turmoil was associated with Italy and the euro. Yesterday, Fitch downgraded several Italian banks without any impact on stocks or debt. Perhaps the gold/silver ratio at a new high of 84.3 (matching the 2008 high of 84.4) is a sign of international stress, but bitcoin has been crushed the last two sessions. In any case, India rupee made a new low for the year, as did Hang Seng.
–News today includes ADP expected 200k, ISM Services expected 56.8, Factory Orders -0.6 and Durables -1.7. There will likely be more political drama with the NY Times op-ed from an anonymous WH staffer bashing Trump. I’d wager that the source will be revealed before midterm elections and will probably solidify Trump’s support.
Sept 5. US manufacturing surge as EM falters
–US yields rose yesterday as ISM Manufacturing came out at a blistering 61.3. There has only been one other reading higher this century, 61.4 in May 2004. Increased IG issuance also cited for pressure on FI. Ten year yield up 5.1 bps from Friday’s close, to 290.2. New buyer of 25k FVV 113.25p for 15.5/16.0; settled 16.5 vs 113-065, likely related to a corporate hedge. Continued buying in EDZ8 9750/9762c 1×2 for 1.0 bp; looking for a Fed pause in December due to EM rout.
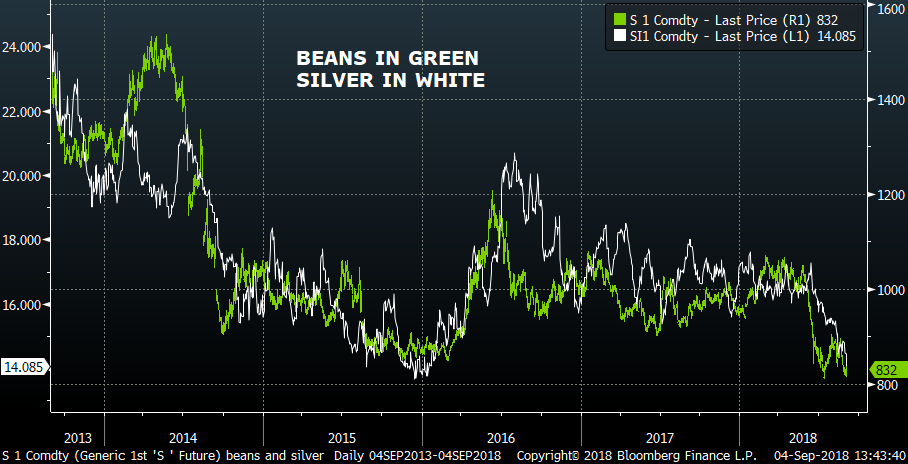
–Emerging markets continue to wobble with S Africa’s rand plunging to a new low this morning. India rupee also at new low. Heavy losses yesterday in metals. Copper was crushed, testing the low from August. Silver was especially weak, SIZ was down nearly 38 cents yesterday and is off nearly 20% from the high in June. As shown on the chart below both beans and silver are back to the energy induced lows at the end of 2015/start of 2016. Gold/silver ratio is back to the high set in 2008, according to BBG.
–This morning stocks are weaker, as is WTI which failed an early morning rally yesterday right at the high of the range. As the threat of storm Gordon recedes, CLV is down another $1; interest rate futures are attempting to claw back yesterday’s losses. News today includes Balance of Trade.
Sept 2, 2018. Hunger Stones

In the current conditions, more than a dozen of the hunger stones can now be seen around Děčín, recording the low water levels of years and centuries long ago — “chiselled with the years of hardship and the initials of authors lost to history,” as described by the authors of a 2013 study on historic Czech droughts.
The oldest and most famous of these landmarks, known simply as “Hunger Rock” according to Děčín’s tourist guide, contains an inscription that dates back to 1616, which reads: “Wenn du mich siehst, dann weine” (If you see me, weep).
There were several articles in the past week about Hunger Stones, revealed in the Elbe River due to low water levels related to drought conditions. The stone pictured above “…expressed that drought had brought a bad harvest, lack of food, high prices and hunger for poor people.” A relic of an ancient time. Now it’s a tourist draw. The message however, cuts to the core for humanity, a signal of profound suffering and helplessness. All that’s left is the crying.
Another ancient relic is gold. A curiosity of a different era. The framework of modern western civilization is founded on electronic impulses, communication, and constantly adapting supply chains. The capitalist system adjusts for scarcity by price, incentivizing new supply or alternative products at relatively cheaper prices, thus filling the void. Hunger? Amazon will deliver today from Whole Foods. We have governments to smooth out the rough spots. For example, I remarked to a friend from trading floor days about the vicious decline in the price of soybeans from the early part of June. He is from an agricultural heritage and told me the crop will be huge, but also sent me the USDA’s press release. ‘Details of Assistance for Farmers Impacted by Unjustified Retaliation’. This program starts on Tuesday, September 4, and provides cash adjustments to farmers: $1.65/bushel for beans, $8.00/head for hogs, $0.14 bushel for wheat, etc.
Getting back to the price of gold, it has ranged from about $1140 to $1340/oz and is now near the lower end of that range. It’s pretty much been sideways action since 2013. Fairly low on drama. However, consider the chart below:
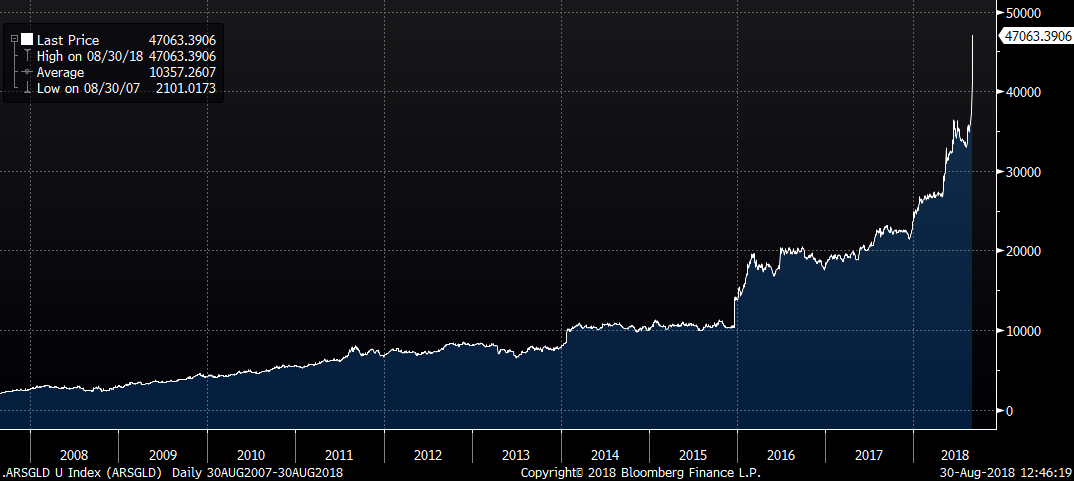
That’s the chart of gold in terms of the Argentinian peso. It makes for a much more compelling story when viewed by a guy in Buenos Aires, through the lens of economic mismanagement. Obviously, Argentina is a unique case. As is Brazil. As is Turkey. Etc. For a broader perspective, the chart below is more appropriate:
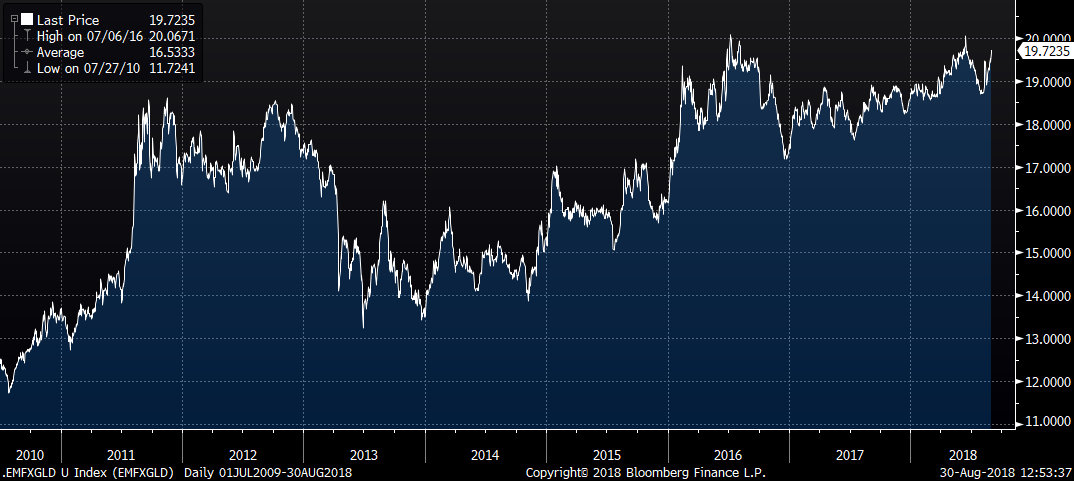
That’s the price of gold in terms of the Illinois dollar, or rather in terms of the JPM EMFX index. Not quite as meteoric of a rise. But the ancient relic still might save a few tears.
I know it’s a poor, modern analogy to compare the omens on hunger stones to the US yield curve. Using a chisel and a hammer on stone during famine isn’t quite the same as typing out a few inane lines on twitter. However, we’re getting a lot of warnings about yield curve inversion and its implications for forward economic growth. For example, Barrons this week has a piece titled ‘Will the flattening yield curve lead to recession?’ This essay notes “If the FF rate exceeds the two-year note rate, banks begin to tighten credit standards…[then] a recession ensues.” It continues, “Unlike other yield curve measures, the spread between the FF rate and the 2-yr note actually has been widening since last summer.”
So the Fed effective, now at 1.92%, and the 2-yr note, now at 2.63%, are at a spread of 71 bps. However, this spread will narrow significantly with the Fed’s expected hike on 26-Sept. That’s likely to be the same case with the spread between the 3-month t-bill rate and the ten year, the curve measure favored by the SF Fed. On the Eurodollar curve, the spread between reds (the second year forward) and greens (third year forward) has been negative for the past 16 sessions, and hasn’t been above +2 bps since the summer solstice. The Eurodollar curve is unmistakably sending the message that growth is going to slow; that fiscal measures related to the tax cuts are going to wane in their effect on the economy. The question is whether the message is correct. Currently it appears as if a lot of supply chains are at risk of being disrupted. Tightening of dollar rates is causing tears for countries that have recklessly borrowed in dollars. The pain has spread to some areas of the global banking system.
Dollar denominated assets have provided refuge. In some cases etf’s and other index products have masked relative weakness and vulnerabilities. However, risks are growing even in the US, especially in light of absolute levels of buoyancy. The curve reflects those forward risks. When 2’s/10’s goes negative, weep? No. Weeping is for the depths of despair. But lighten up on big tech.
This week brings ISM manufacturing (Tuesday) and Services (Thursday). The employment report is Friday, with non-farm payrolls expected 190k. As mentioned last week, the NFP report in September of last year was a large miss, coming in at only 156k. In the ensuing week, the ten year yield traded to 2.06%. By May of this year, the yield had surged over 100 bps to 3.09%. Now we’re 2.85%. Strong data this week would likely see only a limited increase in yields, while weak data has open space to the downside, especially if 2.78% doesn’t hold.
In: Eurodollar Options
August 31. Change of season
–Yields eased Thursday as emerging market stress intensified with a new plunge in the Argentinian peso. Ten year yield fell 2.3 bps to 285.9. Red through blue Eurodollars all +3 on the day. Volume was light. Late in the day Trump threatened additional tariffs on China, triggering an immediate offer in stock index futures, but losses were fairly well contained. PCE Core yoy prices were at 2.0%, right on target.
–This morning Chicago PMI is released, expected 63.0 from 65.5. University of Mich Sentiment and Inflation expectations also out.
–Activity was light in front of the holiday weekend. As an interesting(?) side note, last year Labor day was on Sept 4. The employment report was Sept 1, and showed a gain of 156k in NFP. Vs expected 180k TY settled 126-305 on the day. The yield was 2.17%. This is when tensions with N Korea were at a fever pitch. The following Friday on Sept 8, the contract put in its high at 128-035 (ten year yield 2.06%) and hasn’t been close since. Pivotal time of year? ES1 was 2450 and is now 2900, about 18% higher even as the ten year yield is up 80 bps. The holiday weekend and change of season can presage a shift in market sentiment as well (more likely in stocks this time than in treasuries). Rolling crises in EM provide a backdrop of instability, and weakness in banking stocks and interest rate spreads relating to Italy add to the mix. On top of that are lingering legal challenges facing Trump.

