Aug 29. EM FX… increasing risk
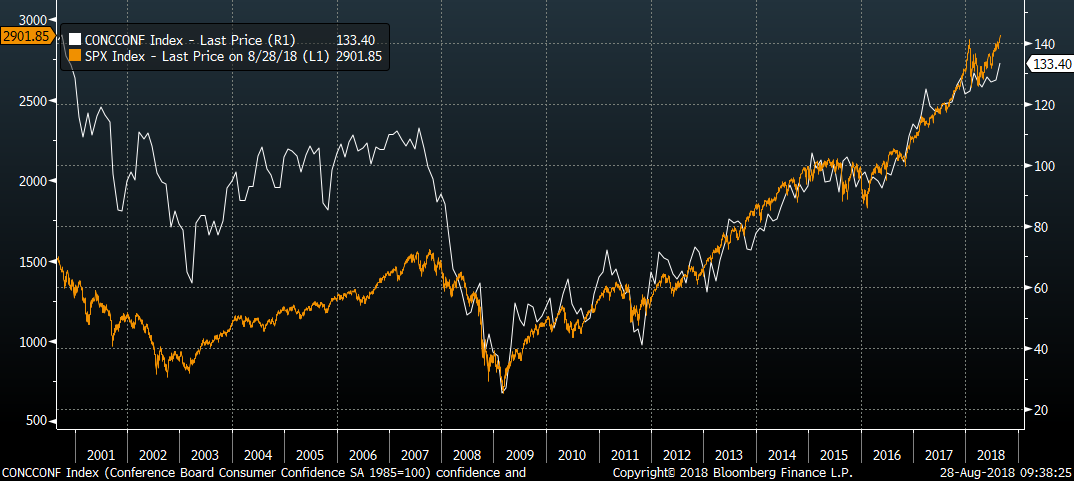
–Yields rose yesterday with tens up 3.6 bps to 288.2. Consumer Confidence hit a new 18 year high at 133.4. Stocks remain buoyant, grains. not so much. Nov Soybeans made a new low settlement at 833 1/4, down 15 cents on the day and down over 20% from the high in May. A huge crop and the China trade situation are to blame; Dec Corn also testing July’s lows.
–Vols firmed in rates yesterday with higher yields. Today brings the final leg of the auctions with the 7 year (the market often rallies out of the third auction). Economic news includes the 2nd estimate of Q2 GDP, expected 4.0%. New high yesterday in EDU8/EDZ8 at 27.25 with just under three weeks to go for September expiry. EDZ8/EDH9 is 15.5, right at its high, with the latter being a good sale IF one thinks December could be the last hike.
Aug 28. Consumer Confidence and stocks
Below is a chart with Consumer Confidence (in white, new high today at 133.4) and SPX (in amber, also new high). Obviously since 2008 these two are joined at the hip.
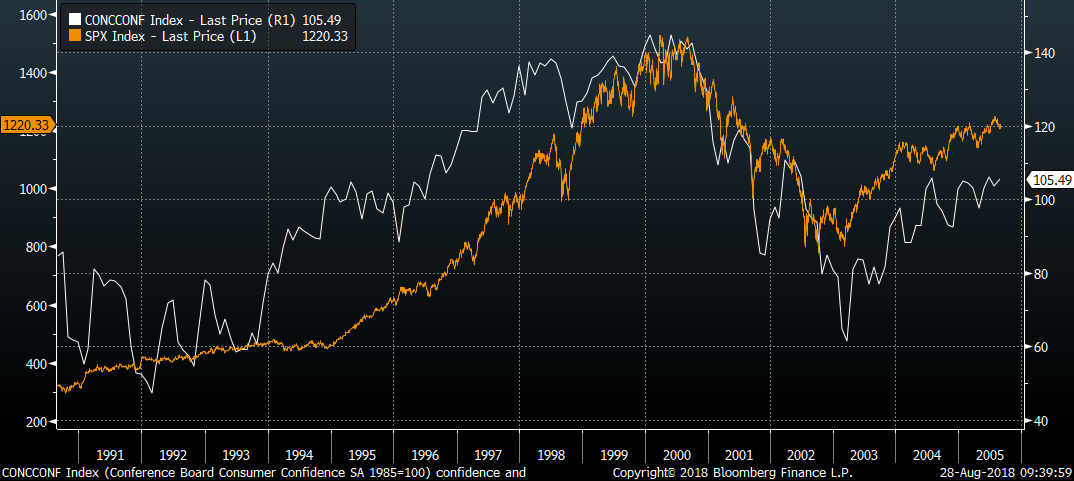
High consumer confidence is usually associated with propensity to spend by economists, and so is thought to be supportive of consumption. But confidence is locked to stock values as well, which suggests a “wealth effect” relating to consumption. Powell has tried to separate the idea of Wall Street and Main Street…. The economy is NOT the stock market. But this chart is fairly compelling evidence that the business of America is finance.
The lower chart shows the same two series over a different time frame, from 1991 to 2005. It was in the late 1990’s when Greenspan’s Fed was most concerned with the wealth effect as it related to Household Spending.
August 26. We’ll fix it when it breaks
Powell’s Jackson Hole speech was interesting, if only in terms of its omissions. Perhaps in response to recent criticism of the Fed, it was pretty much boilerplate, “Stay in our lane” type stuff. Stick to our mandates and manage expectations amid myriad uncertainties.
What was the most glaring omission? Reference to financial stability, which some had thought was going to be a stealth third mandate for Powell’s Fed. There was but one off-handed comment regarding the topic: “Whatever the cause, in the run-up to the past two recessions, destabilizing excesses appeared mainly in financial markets rather than in inflation. Thus, risk management suggests looking beyond inflation for signs of excesses.”
Most of the speech dealt with navigating monetary policy by the stars of the neutral interest rate, the natural rate of unemployment and the inflation objective. It’s an obtuse defense of the Fed’s independence and qualitative decision-making. Thus, Powell lauded the Greenspan Fed for holding rates steady as inflation failed to materialize in 1996 through 1998. Here’s the quote from Powell’s speech:
Over the next two years, thanks to his considerable fortitude, Greenspan prevailed, and the FOMC raised the federal funds rate only once from mid-1996 through late 1998. Starting in 1996, the economy boomed and the unemployment rate fell, but, contrary to conventional wisdom at the time, inflation fell.
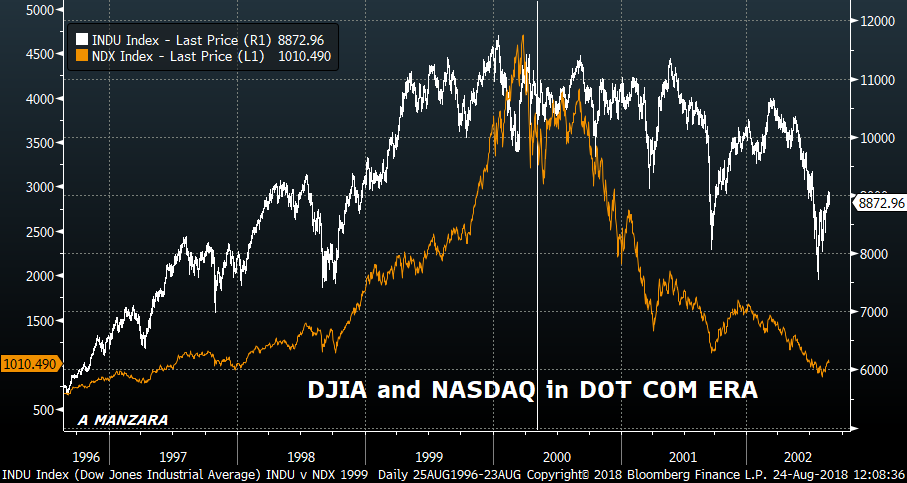
I found a rather interesting WSJ article from May 8, 2000, ‘How Alan Greenspan Finally Came to Terms with the Market’. Far from exhibiting teflon fortitude, Greenspan was constantly wrestling with asset valuations and the appropriate Fed response. It was in December 1996 that he gave the famous “Irrational Exuberance” speech. Stocks fell in the immediate aftermath, but then quickly resumed their upward march (see chart below). As the article details, over time Greenspan accepted the surge in stocks as being “…driven largely by ‘very intelligent investors.’ He added, ‘That’s not the same as saying that they’re going to be right. But they are rational, informed judgments.’
https://www.wsj.com/articles/SB95774078783030219
The article explores how Greenspan’s thinking evolved: After 2 1/2 futile years, Mr. Greenspan dropped the project. To his 1996 question, “how do we know when irrational exuberance has unduly escalated asset values?” he finally gave this answer in 1999: It’s impossible to know, except in hindsight.
And so, in May of 2000 we’re back in present tense: Mr. Greenspan’s conclusions are evident in his recent words and actions. He has backed away from suggesting the market is overvalued, yet feels that monetary policy should reflect the market’s impact on the economy. The bull market’s surprising endurance has driven the Fed into its first sustained drive to raise interest rates in six years. Friday’s report that unemployment fell to a 30-year low of 3.9% means that campaign will continue, as the Fed is expected to raise rates again — possibly by half a point – at its May 16 meeting.
This was the time of ‘wealth effect’ discussions.
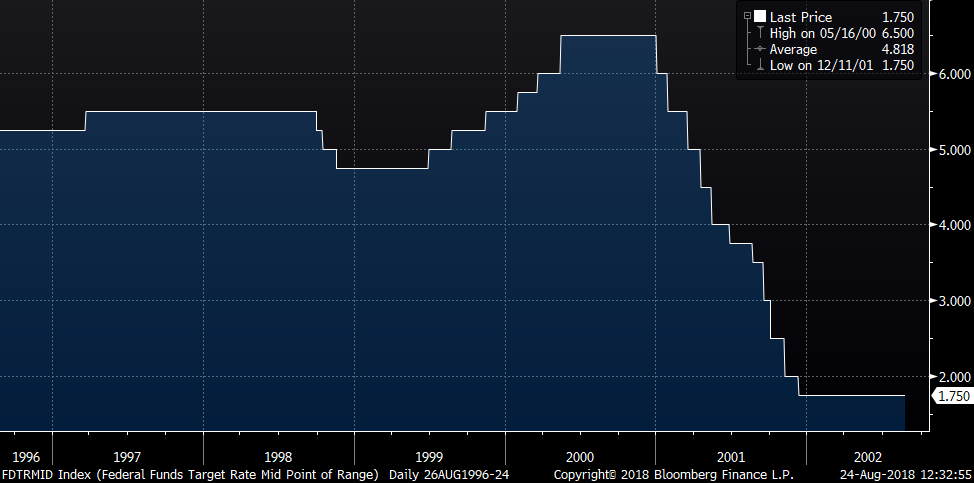
As can be observed in the second chart below, the correctly predicted 50 bp hike to 6.5% in May 2000 was the last of the cycle. The vertical line on the stock chart is the date of the WSJ article. Stocks had actually topped earlier in the year, and it was later in 2000 when Nasdaq imploded (amber line). The Fed’s response was to slash rates in 2001 from 6.5% to 1.75%. Is it worth noting that 2/10 treasury spread was -45 bps in April 2000 and -40 in May? And that the peak 10 year yield of 6.68% was set in January 2000? (which incidentally is the highest of this century).
The point of this trip down memory lane is to highlight what appears to be an inconsistency in Powell’s speech. He knows that dislocations in financial markets are the largest risk the Fed faces, but has chosen to focus – at least in this speech – on basic economic parameters in terms of policy. It’s also worth a mention that both Friday’s speech and the Fed minutes released on Wednesday noted constraints on fiscal policy with respect to a response in the event of a possible downturn, due to large (unsustainable) deficits. In 1998-2000 the Federal Gov’t ran budget surpluses!
Where are we now? Longest bull market ever. SPX made a new all-time high. VIX sub-12. Market cap to GDP nearing the high set in 2000. The unemployment rate is right where it was at its lows in 2000, 3.9%. The curve is making new lows. The 2/10 treasury spread closed the week just under 20 bps. The red to gold euro$ pack spread is on its low at MINUS 1. The most inverted part of the curve is reds to greens (2nd to 3rd year out) which settled -2.0. Many analysts think that effects from the tax program will be waning by mid to late 2019. The Eurodollar curve appears to be sending the same message. As for stocks, it’s TINA. There Is No Alternative, especially if yields are steady to lower. Rational and informed.
Steady as she goes, keep hiking until something breaks. Which might explain why the Fed’s staff is fretting about how to handle the ELB (or effective lower bound) when we next experience it, which was the opening topic in the Fed minutes released Wednesday.
In terms of the Fed’s fine-tuning of communication skills, I’ll just end with another timeless quote from the WSJ article, perhaps equally appropriate for the Fed and for other branches of government.
Many of those who make their living in the stock market felt much the same way. “Why don’t you guys shut the f— up?” one investor told an official of the Federal Reserve Bank of New York at a recent social event.
Just a couple of other notes. The earthquake map remains highly active. The Japanese tsunami was in 2011, on March 11. At the start of 2011 the US ten year yield was as high as 3.65%. By late September it was 1.73%. How much was Japan and how much was related to other factors? As Fred Sanford would say, “This is the big one! I’m comin’ to join you Elizabeth!”
Auctions of 2s, 5s and 7s should keep pressure on the curve early in the week.
| 8/17/2019 | 8/24/2018 | chg | |
| UST 2Y | 261.6 | 262.4 | 0.8 |
| UST 5Y | 275.0 | 272.2 | -2.8 |
| UST 10Y | 287.1 | 282.2 | -4.9 |
| UST 30Y | 302.9 | 297.1 | -5.8 |
| GERM 2Y | -65.0 | -59.5 | 5.5 |
| GERM 10Y | 30.5 | 34.5 | 4.0 |
| JPN 30Y | 84.7 | 83.3 | -1.4 |
| EURO$ Z8/Z9 | 36.5 | 34.5 | -2.0 |
| EURO$ Z9/Z0 | -1.0 | -2.0 | -1.0 |
| EUR | 114.38 | 116.22 | 1.84 |
| CRUDE (1st cont) | 65.21 | 68.72 | 3.51 |
| SPX | 2850.13 | 2874.69 | 24.56 |
| VIX | 12.64 | 11.99 | -0.65 |
August 24. Jackson Hole
Aug 23. Tremblers
https://www.federalreserve.gov/monetarypolicy/fomcminutes20180801.htm
–Why did the Aug 1 FOMC minutes start with staff analysis of how the Fed might handle a return to the Effective Lower Bound (ELB)? Perhaps a purely academic exercise, but here are some additional quotes: “Many participants commented on the monetary policy implications of the apparent secular decline in neutral real interest rates. … Fiscal policy was viewed as a potentially important tool in addressing a future economic downturn in which monetary policy was constrained by the ELB; however, countercyclical fiscal policy actions in the United States may be constrained by the high and rising level of federal government debt. …spells at the ELB could become more frequent and protracted than in the past, consistent with the staff’s analysis. Moreover, the secular decline in interest rates was a global phenomenon, and a couple of participants emphasized that this decline increased the likelihood that the ELB could bind simultaneously in a number of countries. ….participants acknowledged that there may be limits to the effectiveness of these tools in addressing an ELB episode. They also emphasized that there was considerable uncertainty about the economic effects of these tools.” Doesn’t sound particularly optimistic.
–On the other hand, Reuters this morning reports that Weidmann says ECB mustn’t delay rolling back stimulus.
–On Wednesday yields started lower and then edged back up as stocks recovered from the shock that Trump might have engaged in unseemly behavior. 2/10 posted a new low, closing 22.8. From the March hike to the June hike, 2/10 went from 55 to 39 or 16 bps. Since then we’re a t 23, another 16 bps. Safe to call it 1/8 % to 3/16% of flattening per hike?? Maybe. Which would indicate single digits after the September meeting.
–Gold walloped this morning by $10 as USD again strengthens.
–Job Claims and New Home Sales this morning. Powell’s Jackson Hole speech tomorrow.
–Nothing earth shaking in the markets, BUT….the earth is shaking. Many earthquakes in the ring of fire over the past 48 hours. Here’s a great link:
August 22. Trump rally at risk
Aug 21. You want something to cry about? How about Fed policy in 2005?
Aug 20. Edging higher
August 19, 2018. THINK
“You better think about the consequences of your actions.” Aretha Franklin to Matt Guitar Murphy.
*old youtube link of Matt Murphy at bottom, who also passed this year.
“Ma’am you gotta understand that this is a lot bigger than any domestic problems you might be experiencing.” Elwood.

No Merchandising. Editorial Use Only. No Book Cover Usage.
Mandatory Credit: Photo by Universal/Kobal/REX/Shutterstock (5885886l)
John Belushi, Aretha Franklin, Dan Aykroyd
The Blues Brothers – 1980
Director: John Landis
Universal Pictures
USA
Comedy
In the famous diner scene in the Blues Brothers, Aretha Franklin admonishes Matt Guitar Murphy to think about the consequences of his actions before going back out on the road with the band. Elwood eloquently appeals to the broader context of the situation. And then Aretha belts out the song THINK.
The Central Banks of the world were forced into action after the GFC, perhaps without thinking through the [unintended] consequences of policy actions. Now the ‘dollar shortage’ being experienced by several emerging markets is leading some Elwoods to advise Jay Powell that international issues are larger than the domestic problems of normalization and inflation stability.
In a speech on May 8 about international capital flows, Powell preempted those concerns, and more or less dismissed the impact the Fed would have, saying that clear communication about forward policy would allow other economies the chance to adjust, though he added that the Fed would be sensitive to risks. From the speech:
All that said, I do not dismiss the prospective risks emanating from global policy normalization. Some investors and institutions may not be well positioned for a rise in interest rates, even one that markets broadly anticipate.
Nevertheless, risk sentiment will bear close watching as normalization proceeds around the world. What can the Federal Reserve do to foster continued financial stability and economic growth as normalization proceeds? We will communicate our policy strategy as clearly and transparently as possible to help align expectations and avoid market disruptions.
The main event of the upcoming week will likely be Powell’s speech at Jackson Hole on Friday. His previous speech on June 20 was ‘Monetary Policy at a Time of Uncertainty and Tight Labor Markets’. The title refers to ‘tight labor markets’, NOT ‘tight funding conditions for EM dollar borrowers’. His speech has this excerpt: “Unemployment was below 4 percent from February 1966 through January 1970. During that time, inflation as measured by the price index for personal consumption expenditures increased from below 2 percent in 1965 to about 5 percent in 1970. In hindsight, unemployment is now widely thought to have been unsustainably low at that time and to have contributed to escalating inflation.” Will Powell focus on domestic or international risks?
In any case, there has been increased speculation that the Fed may have to consider scaling back balance sheet normalization in light of dollar strength. Additionally, the narrative early in the year of synchronized global growth has devolved into a patchwork of slowdowns and crises.
It’s somewhat interesting to note that exuberance in the beginning of the year was tied not only to Trump’s tax program, but also linked (coincidentally?) with a surge in China’s Total Social Financing in January. China’s financing growth has since stalled, although the FT reports that “Beijing orders banks to boost lending to exporters.”
August 13 – Bloomberg: “China’s broadest measure of new credit slowed, underlining concerns about the economy that have prompted authorities to start doing more to support growth. Aggregate financing stood at 1.04 trillion yuan ($151bn) in July… That was slower than the 1.39 trillion yuan in June, using the central bank’s new calculation method for this data. (From Noland’s Credit Bubble Bulletin)
https://tradingeconomics.com/china/loans-to-private-sector
During previous periods of QE, bonds didn’t do all that well, it was the equity market that recognized bullish ramifications of increased liquidity. Amazingly, the taper has done little to dent sentiment regarding US stocks. If anything, recent weakness out of China has been a bigger factor, with big tech stocks performing poorly (TENCENT made a new low for the year this week, BIDU and BABA are near the low end of the range for the past 12 months). Shanghai Comp was down 4.5% on the week.
The question is, what if Powell hints at a change in balance sheet normalization (which was supposed to run on autopilot in the background)? Is the market going to suddenly realize that the Fed has changed its assumptions about domestic growth prospects? In that case, bonds could see an explosive rally, fueled in part by Gundlach’s tweet this weekend: ‘Massive increase this week in short positions against 10 & 30 yr UST mkts. Highest for both in history, by far. Could cause quite a squeeze.”
But what of stocks? Again, the initial reaction would surely be a surge, but it might be taken as a selling opportunity. What we’ve ignored so far is the Bank of Japan. An article on Reuters Friday said: BOJ may be ‘stealth tapering’ in stock markets, analysts say.
The BOJ has already slowed bond buying, and a removal of support in the form of ETF purchases may reverberate globally. Since the last BOJ meeting, the 10y JGB has held around 10 bps, but the thirty year adjusted up from below 70 to around 85 bps, and has since remained there.
So what are markets signaling currently? In the US, a September hike is priced in the FF market with October Fed Funds at 2.145% (9785.5) vs current Fed Effective 1.91 to 1.92%. A spread of 23 bps indicates nearly full odds of a hike. A spread of 16.5 between Nov and Jan Fed Fund contracts puts odds for another hike in December at about 2/3rds. However, prices on the euro$ curve from the end of next year forward are inverted and spreads are quite stable, an omen that growth will have ceased by then. For example Dec’19 to Dec’20 euro$ spread closed -1 bp, and spreads just beyond are even more negative. Though Turkey has taken some steps to stabilize, large European banks with exposure remain near their lows. BNP is down 26% since late Jan and BBVA is down 28%, while UniCredit is down 29% since April with the Italian Bank Index down 27% since May. Italy 5y CDS went from about 100 bps at the start of the year to 265-270 in late May, and is now 242 bps, compared to Spain at 71. The German 10y bund closed the week testing support at 30 bs, having been above 75 in Q1. A break of this support area would point back to single digits.
There are hopes that the US and China can resolve trade differences with low level talks occurring as a roadmap for a possible Trump-Xi meeting in November (post-elections), but the signs of fraying across many financial markets casts a shadow on the US as a sole pillar of solid global growth.
| 8/10/2018 | 8/17/2019 | chg | |
| UST 2Y | 259.6 | 261.6 | 2.0 |
| UST 5Y | 273.1 | 275.0 | 1.9 |
| UST 10Y | 285.9 | 287.1 | 1.2 |
| UST 30Y | 301.9 | 302.9 | 1.0 |
| GERM 2Y | -63.5 | -65.0 | -1.5 |
| GERM 10Y | 31.7 | 30.5 | -1.2 |
| JPN 30Y | 83.5 | 84.7 | 1.2 |
| EURO$ Z8/Z9 | 34.5 | 36.5 | 2.0 |
| EURO$ Z9/Z0 | -0.5 | -1.0 | -0.5 |
| EUR | 114.12 | 114.38 | 0.26 |
| CRUDE (1st cont) | 66.94 | 65.21 | -1.73 |
| SPX | 2833.28 | 2850.13 | 16.85 |
| VIX | 13.16 | 12.64 | -0.52 |
https://www.youtube.com/watch?v=rT8D_L2bBGQ
August 17, 2018. Philly Fed omen?