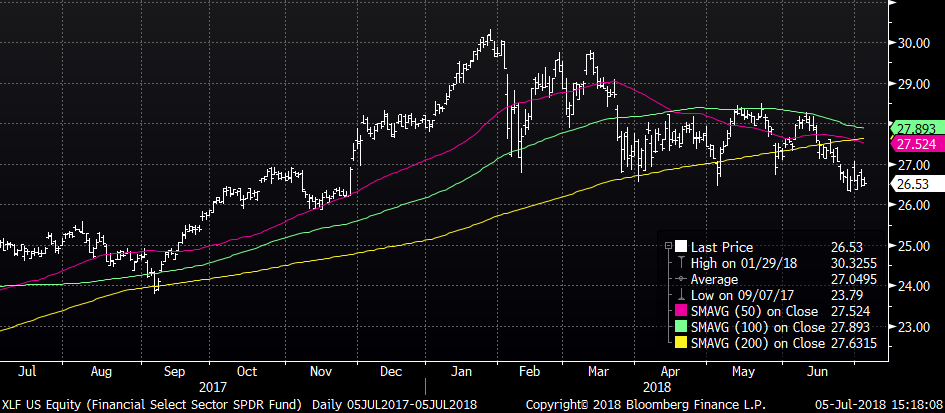
July 16. If the Fed stops hiking buy stocks. Right?!?!
July 15. Late Cycle Behavior… What’s next?
Both Jeffrey Gundlach and Bill Gross made bullish calls on commodities earlier in the year. I think I recall Gundlach saying a rise in commodities is ‘classic late stage behavior’. I did a quick search and found this quote from mid-January: “Commodities always rally sharply – much more sharply than they have so far – late in the business cycle as we lead into a recession.”
This week was a trying one for commodity bulls. In no way am I trying to cast a negative light on the earlier calls, because they were absolutely correct. The question is, if a commodity rally is ‘classic late stage’ stuff, and if commodities have now turned, what comes next?
On Wednesday, front month WTI took a dive, falling $3.73. On the week it fell 2.79 to 71.01, yet it is still well above the lows from early June (64.00 to 65.00/bbl). However, other commodities have absolutely plunged. Silver fell to a new low settle Friday. Soybeans made new lows, same with corn. As mentioned during the week, base metals have melted, with Dr Copper down 17% from its high in June. These moves are related to trade war concerns and strength in the USD. There are also a slew of technical factors, the intricacies of which I don’t pretend to know. Not only don’t I know, it seems as if some of the most sophisticated players have been caught out, as a Reuters article on energy notes: “Trading desks of oil major BP, and merchants Vitol, Gunvor and Trafigura have recorded losses in the tens of millions of dollars each as a result of the “whipsaw” move when the spread [between WTI and Brent] reached more than $11.50 a barrel in June, insiders familiar with their performance told Reuters.” I don’t think the article (link at bottom) does justice to a complex topic, but it gives a sense of underlying turmoil. I’ve highlighted vicious rallies in near WTI calendar spreads in daily notes, and I’m sure there are other more nuanced moves between products. Actually, spread moves have had all the nuance of a sledgehammer. The point is that smooth, discrete moves are perhaps becoming less of a feature, (and more of a bug?)
These moves come at the same time that many (IMF, BIS, etc) are sounding the alarm on excessive global debt. Financial bloggers anxiously scream that these debts will NEVER BE REPAID! That’s not really the crux of the problem. The issue is whether the debts can be serviced and rolled. The problem is that one man’s debt is another man’s asset, and if the ‘collateral’ underlying these debts were commodities, why, then we might have reason for concern on both counts. Especially if those debts are dollar denominated. Thankfully though, tech stocks are the pillars of the US economy, and it’s there that we can take solace in *socially driven and beneficial for mankind* decision making, an example of which is WeWork banning meats from company events and expense reports. It’s really no wonder that Nasdaq soared to a new high this week. However, on Tuesday the Russell 2000 posted an outside day and closed lower, essentially leaving a double top just under 1710 (cash index) on June 21. These highs remain intact (even with a new high in Nasdaq), and represent strong resistance. It’s hard to buy into the scenario of robust economic growth if only a few tech names provide all the juice.
The interest rate curve is reflecting similar trepidation with respect to forward economic prospects. On Friday, the 30-yr and ultra bond contracts had new high settlements, exceeding highs set in late May when concerns about Italy gripped the market. Inversion on the Eurodollar curve keeps edging closer in time. Many one-year Eurodollar calendar spreads made new recent lows, for example, EDM19/M20 settled at a new low of just 8.5. This spread is one year forward, and more or less indicates that the Fed’s tightening campaign will be over by then. If there’s any doubt as to timing, the next spread, EDU19/U20 is only 2 bps, and then… depression set in. https://www.youtube.com/watch?v=GbVaisNPgh4
I mean, then inversion sets in, with EDZ19/EDZ20 at MINUS 2. Last week was the first time this spread traded negative, and it’s the nearest one-yr inversion. The red Eurodollar pack (2nd year forward) is at a higher yield than the green pack (3rd year) which in turn, is at a higher yield than the blue pack (4th year) 2.955%, 2.9337%, 2.9175%. These spreads are at new lows for this cycle, and near lows of previous tightening cycles. Until the Fed changes its tune on future gradual rate hikes, the back end of the curve is announcing that, gradually, rate hikes will choke the economy.
Doesn’t this inversion signal possible risks to financial stability? Perhaps. However, the semi-annual monetary report released by the Fed on Friday doesn’t really address that topic in the section entitled, Developments Related to Financial Stability. Instead, the Fed says that risks are generally low, while noting that “valuation pressures in various asset markets remain elevated by historical standards…” and that “commercial property valuations continue to be stretched.” The report says “Risks from abroad are moderate overall” and concludes this section with “Globally, potential downside risks to internat’l financial markets and financial stability include political uncertainty, an intensification of trade tensions, and challenges posed by rising interest rates.” On the last point, the Eurodollar curve is sending up a flare. On trade tensions, commodities might be sending up a flare. And on political uncertainty, well, we can all draw our own conclusions. This week’s Trump/Putin summit will perhaps paper over uncertainties regarding US/Russia relations. On the other hand, the prospect of China using slow currency depreciation vs USD is another clear risk to international capital flows.
So we have a pretty good handle on possible threats, and some pockets of the interest rate markets are gently pricing these risks. The commodity complex has been more strident. VIX is on a summer stroll through the countryside. Implied volatility in interest rates is similarly languishing near lows. It’s hard to lay out premium when every shock is absorbed in shorter and shorter cycles. This is when tails should fatten.
| 7/6/2018 | 7/6/2018 | chg | |
| UST 2Y | 254.1 | 258.2 | 4.1 |
| UST 5Y | 272.1 | 272.7 | 0.6 |
| UST 10Y | 282.9 | 282.9 | 0.0 |
| UST 30Y | 293.8 | 293.3 | -0.5 |
| GERM 2Y | -65.8 | -66.3 | -0.5 |
| GERM 10Y | 29.2 | 28.0 | -1.2 |
| JPN 30Y | 67.9 | 67.9 | 0.0 |
| EURO$ Z8/Z9 | 32.0 | 31.0 | -1.0 |
| EURO$ Z9/Z0 | 1.0 | -2.0 | -3.0 |
| EUR | 117.44 | 116.85 | -0.59 |
| CRUDE (1st cont) | 73.80 | 71.01 | -2.79 |
| SPX | 2759.82 | 2801.31 | 41.49 |
| VIX | 13.37 | 12.18 | -1.19 |
July 13. Implied vol crushed on US interest rates; CNY makes new low
–Vol crushed in rates yesterday on heavy straddle sales. With inflation data out of the way, and auctions having been easily absorbed, all straddles on ED curve lost 1-2 bps. In addition, publication of an interview with Powell was uneventful. Sales included 5k EDU9 9812.5^ at 44.0, 7k 0EH 9700^ at 43.5, 5k 0EM 9700^ at 53.0, etc. Same in treasuries, where US August and Sept straddles each fell 10/64’s from Wed to Thursday settles: USQ 145.5^ from 1’36 to 1’26 and USU 145 from 2’50 to 2’40. Late in the day there was a buyer of well over 100k EDH9 9800c for 1.0 (EDH9 settled 9720.5). This was a short cover buy of a trade early in the year, -EDH 9800c to buy 9750/9737ps, but the open interest sheet only shows a decline of 7300 contracts, so data is sometimes suspect on prelim sheets….
–The indiscriminate vol selling may be somewhat misguided, as this morning’s news reveals a record June Chinese trade surplus. Interestingly, the yuan is at a new low this morning 6.6979, a level not seen since last August. From RTRS: “…data showing China’s trade surplus with the United States swelled to a record in June as exports grew could further inflame tensions.” USD stronger across the curve.
–Marginal new lows yesterday in 2/10, down 1 bp to 25.9 and in 5/30 to 19.5. While front end calendar spreads remain pinned to their highs (indicating high odds of a Sept hike), the flattening further back is relentless until the Fed cries uncle. EDU8/EDZ8 spread closed at its high of 20 and was 20/20.5 during Thursday’s session. Aug/Oct FF spread traded small at 21.5 and settled 21.0; this spread isolates the Sept FOMC.
–In the big picture, the flattening curve and declining yields on long dated assets spurs gains in equities as competition from FI dwindles. Earnings expected to be solid, and now appear more than adequate against 10’s that seem to have decisively turned away from the 3% level (2.85% yesterday).
–The Fed releases its semi-annual Monetary Report to Congress this morning.
July 12. Commodity Carnage
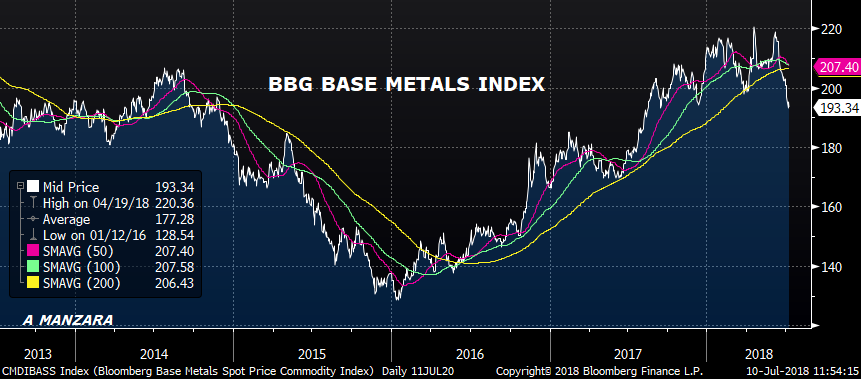
–It’s been a tough month for most commodities besides oil, which did its best to catch up yesterday with Aug WTI down 3.73 yesterday to 70.38. Grains made new lows. Dec Corn was 4.25 in early June, closed at a new low yesterday near 3.53. Beans have plunged from 10.60 to 8.48 over the same time frame. Copper and other industrial metals also hit new lows yesterday. Copper is down 17% from last month’s level, from 3.31 to 2.75. Gold and silver had seen small bounces in the first few sessions of July, but went back down to the lows yesterday. Emerging markets were again under pressure, but it really all seems to be tracking China, where the yuan was set higher this morning and SHCOMP rallied.
–Yields fell yesterday in spite of the ten year auction. Ten year yield fell 2.9 bps to 2.842%. On the euro$ curve, greens were the leaders, rising 4.25 bps, while reds were up only 3.0. Reds to all deferred contracts made new lows. Red/green -1.25 to NEGATIVE 1.25 bps. Red/blue -1.125 to -3.125, and red/gold -0.875 to -0.875. Ominously, the inversion is seeping further up the curve. Yesterday was the first time I saw EDZ19/EDZ20 close underwater, at -1.0. In treasuries, 2/10 posted a new low of 26.8. This in spite of robust PPI data yesterday (yoy Core +2.8. Today brings CPI, expected 2.9 headline and 2.3 Core on a yoy basis, which would both be 0.1 higher than last month.
–The market is pricing high odds of a hike in September, but after that it’s becoming murkier by the day. 30 year auction this afternoon.
July 11. Trump admin pokes China while preparing for NATO/Putin
July 10. Copper vs Oil
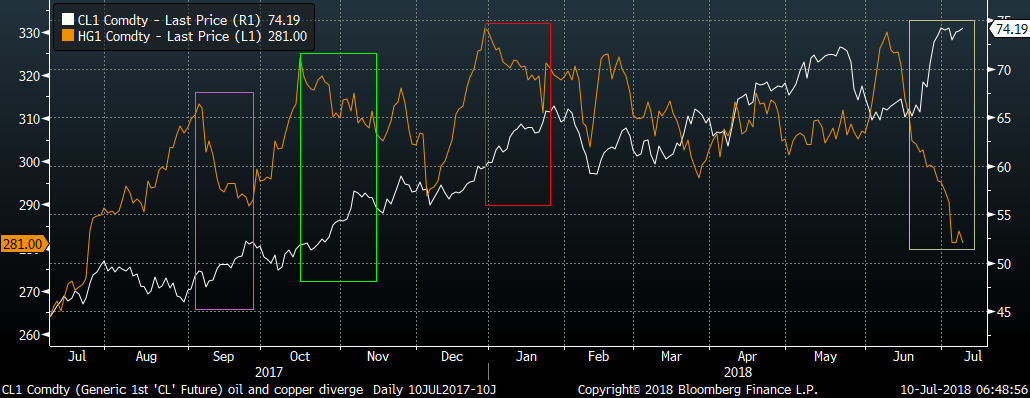
Attached is chart of front copper vs front crude oil contract. Seeing a pretty large divergence in direction on these two economically sensitive commodities. However, I have noted in rectangles several other instances of copper declining while oil maintained a rally, and these have concluded in favor of the rising oil trend. However, in this case, copper is making a significant new low in the face of higher oil…not sure how it resolves this time.
July 10. Crude oil and copper sending different signals on economic strength
July 9. China supporting stocks
–China seems to be having a much larger impact on global markets. Yuan slightly stronger and Chinese stocks rebound; here’s a clip from Reuters: “China’s bourses sailed higher after its securities regulator said on Sunday it planned to ease restrictions on foreign investment in the Shanghai and Shenzhen stock markets, and told banks to significantly cut lending rates to small businesses.” This morning US stocks are higher, and the USD weaker, rate futures slightly lower.
July 8 Weekly. Running with the bond bulls
Despite the release of FOMC minutes and Friday’s employment data, net week-over-week changes were small. The most notable market event was inversion of the Eurodollar curve, where the red pack (2nd year forward) to gold pack (5th year forward) settled NEGATIVE 0.5 bp on Thursday (it bounced back to +0.75 Friday). In treasuries, 2/10 and 5/30 also posted new lows for the cycle on that day. On the week, the 30 yr bond yield fell 5 bps to 293.8. On a technical basis, this level is a just below the 50% retracement from December’s low of 268.8 to May’s high of 324.7. It is also below the closing yield set at the end of May, when bonds spiked higher due to European stress associated with fears that Italy might abandon the euro. At that time, the Italian bank index was posting a new low, and the euro was testing 1.15, also a new low for the year. Since then, there have been small rebounds, with the euro closing 1.1744, up from 1.1683 in the previous week. On Friday the Italian government indicated plans to raise the Deficit/GDP target to around 1.4% from the current goal of 0.8%, but that news was taken in stride as a modest backslide in the context of the broader concerns about the Euro.
Five and ten year yields are still well above end of May levels, so perhaps calling for a general rally led by bonds is premature. However, it appears as if the long end is interpreting the trade war as more of a drag on economic growth than as an inflationary catalyst.
On Friday, Ray Dalio tweeted, “Today is the first day of the war with China.” Also note that he has recently fretted about how the economy will react when US tax stimulus fizzles in 2020. Indeed, on the Eurodollar futures curve, the most negative section is the 2020 contracts vs the 2021 contracts. (EDH0 thru EDZ0 average 97.025, while EDH1 thru EDZ1 average 97.050, for a spread of -2.5 bps). Obviously the markets have taken Dalio’s concerns to heart. I would also note that back month Eurodollar vol remains very well bid given global uncertainties. For example EDH21 9700 straddle was 92.0 bps at the end of February with the contract settling 9702.5 on 27-Feb. In mid-April the contract was 9699.0 and the straddle was 87.5, and just prior to the end of May it was as low as 83.0. On Friday this straddle settled 88.75. Either these are great sales, or the market is hinting of trouble ahead. Interestingly there was a late buyer of 10k EDH21 9550p for 3.0 on Friday after it had already settled 2.75.
Of course, it is not only Dalio that thinks trade wars could be more negative than generally thought. Here’s a quote from BBG on June 29:
European Central Bank President Mario Draghi warned European Union leaders that an escalating trade war between the U.S. and the world’s biggest economies may have a larger impact than policy makers and investors currently expect. …Rising tensions could erode confidence to an extent that is difficult to gauge, Draghi told the 27 heads of government from the bloc at a summit in Brussels on Friday. The complexity of intertwined global supply chains could magnify the impact on the world economy, he said, according to a person familiar with the discussion, who asked not to be named as the debate wasn’t public.
On Monday Draghi addresses the European Parliament in Brussels, and the sentiments above are likely to be expounded upon as tariffs have now been instituted. As Lacy Hunt mentioned on a CNBC interview recently, the synchronized global growth story is now more likely to turn into a synchronized global slowdown.
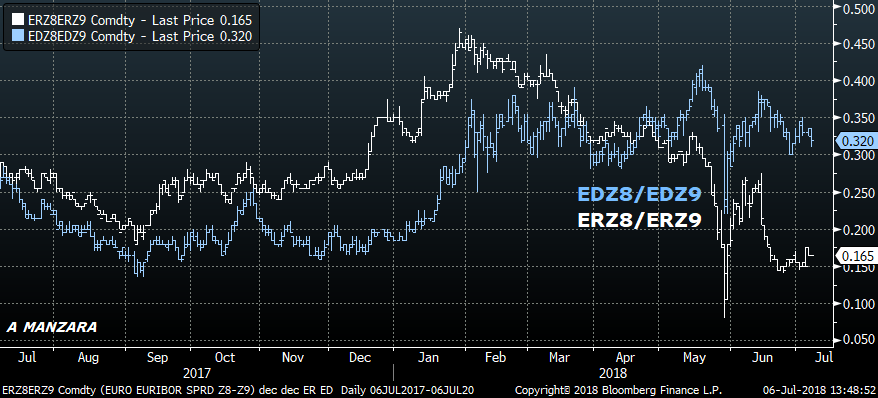
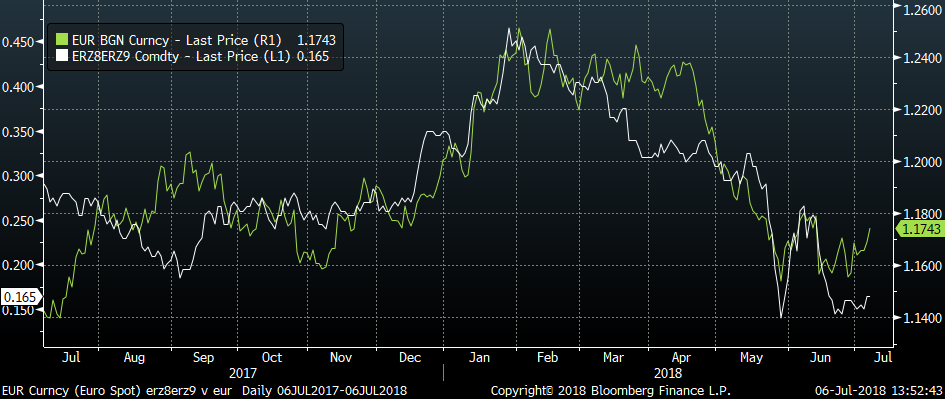
Below are just a couple of charts below relating to the Euro. The top chart plots the one year Eurodollar calendar spread EDZ8/EDZ9 vs the same in Euribor (ERZ8/ERZ9). The euribor spread (in white) has been trending lower since February, while the Eurodollar spread (blue) has held a sideways pattern. The second chart shows the same ERZ8/ERZ9 spread as a line chart in white, with the EURO overlaid in green. Obviously a pretty strong correlation between these two. This week’s euro rally is either just a relief reaction, or it may be an indication that Eurodollar spreads are going to see a bit more flattening in the nearer part of the curve as a reflection of negative consequences of trade wars.
While Draghi speaks at the start of the week, the Fed will release the Monetary Policy Report prepared for Powell’s semi-annual Congressional testimony on Friday, July 13. Powell’s actual testimony will occur the following week on the 17th. Nothing indicates that Powell’s Fed is deviating from a course of gradual rate hikes. If end of the week comments DO indicate a change, then a rush to exit from flatteners will ensue.
This week also includes treasury auctions which will be interesting as the threat of Chinese sales of treasuries hangs over the market as retaliation for tariffs.
OTHER MARKET THOUGHTS/ TRADES
On Friday there was a sale of ~100k TYU 121/122cs at 15/64s. On June 11, TYU 120/122cs bought for 29 to 30 in 100k. Open interest shows a drop of 76k in 122c and rise of 89k in 121c, so the original position has now been switched to long 120/121cs. Settles: 120c 52, 121c 23 and 122c 10. Interestingly, all treasury futures showed open interest increases on Friday’s modest rally, +16.6k TU, +21k FV, +30.5k TY and +5.8k in US. Portends strong demand at auctions.
| 6/29/2018 | 7/6/2018 | chg | |
| UST 2Y | 252.8 | 254.1 | 1.3 |
| UST 5Y | 273.3 | 272.1 | -1.2 |
| UST 10Y | 285.3 | 282.9 | -2.4 |
| UST 30Y | 298.8 | 293.8 | -5.0 |
| GERM 2Y | -66.5 | -65.8 | 0.7 |
| GERM 10Y | 30.2 | 29.2 | -1.0 |
| JPN 30Y | 70.6 | 67.9 | -2.7 |
| EURO$ Z8/Z9 | 32.5 | 32.0 | -0.5 |
| EURO$ Z9/Z0 | 1.5 | 1.0 | -0.5 |
| EUR | 116.83 | 117.44 | 0.61 |
| CRUDE (1st cont) | 74.15 | 73.80 | -0.35 |
| SPX | 2718.37 | 2759.82 | 41.45 |
| VIX | 16.09 | 13.37 | -2.72 |
July 6. Employment data