
July 3. Scarcer reserves and t-bill supply
“Gradually reducing the Federal Reserve’s securities holdings will result in a declining supply of reserve balances.” From the Fed’s June 2017 addendum regarding Policy Normalization.
–Interesting article in WSJ on 1-July: ‘Fed faces decisions on shrinking is huge bond portfolio’ notes that reserves are becoming more scarce. From the article,”…developments in short-term money markets of late raise the question of ‘how long we actually want our balance sheet [wind-down] to go,’ Boston Fed President Eric Rosengren said in an interview last week. It is possible the portfolio will not have to shrink “dramatically more” from its size of $4.3 trillion in June…”
–At least some members of the Fed are concerned about how to deal with the next downturn, and discussions about ending ‘normalization’ of the portfolio likely include this issue. Note that QT in the just started Q3 is now in the amount of $40 billion per month, $24b in treasuries and $16 in MBS. Another interesting policy article is on BBG: Forget the yield curve, the debt market action is in Fed funds.
“As the second half of the year gets underway, T-bill supply is poised to expand by another $290 billion, according to JPMorgan Chase & Co. estimates. Deutsche Bank AG expects an additional $185 billion of net bill sales, most of it arriving in the fourth quarter. ”
–It appears as if volatility may begin to increase in rate markets. Yesterday, the curve flattened with 2/10 down to a new low of 31.7 bps, and 5/30 to new low 24. Green to blue euro$ pack spread closed NEGATIVE 1.375. New buyer of 25k 0EH 9687/9675/9662p strip covered; settled 37.0 vs 96.99.
–This morning the yuan hit a new low, but soothing words from the PBOC reversed the decline. Crude oil at a new high this morning with CLQ +78 to 74.72. Stocks higher. Happy 4th!
July 2. China shockwaves
–New lows in both CNY at 6.6611 and in the Shanghai Composite, -2.5%, appear to be spilling over into US markets with ESU currently -13.50. Bernie Sanders won the election in Mexico, except his name is Andrés Manuel López Obrador, known as AMLO. Mexico first….another reason for tensions to increase on trade and other issues? And good luck this morning to Mexico v Brazil.
–Modest rally this morning in US rate futures. On Friday morning before the Core y-o-y PCE printed at the Fed’s target of 2%, the atm 120.25 straddle for the day was printing 9/64’s. Even this morning, TYU is just 120-12, not quite through what would have been breakeven.
–Both euro and gold lower this morning. There was an interesting post on ZH over the weekend citing BAML on the ‘cheapest hedges for a stock market crash’, and the top rated was gold calls. Even with a stronger dollar gold appears to be in an area of support so it’s worth thinking about…
https://www.zerohedge.com/news/2018-06-30/these-are-cheapest-market-shock-hedges-right-now
–Shortened holiday week could lead to illiquidity at times.
July 1. Investment Grade? – Weekly Comment
In the aftermath of the GFC, the rating agencies came under fire for having given investment grade ratings to dubious securities, primarily in the mortgage market. Should we now be concerned about corporate debt ratings? The market says “Yes”.
Chart below shows rise of BBB spread since the start of the year. Spike in 2016 related to energy.
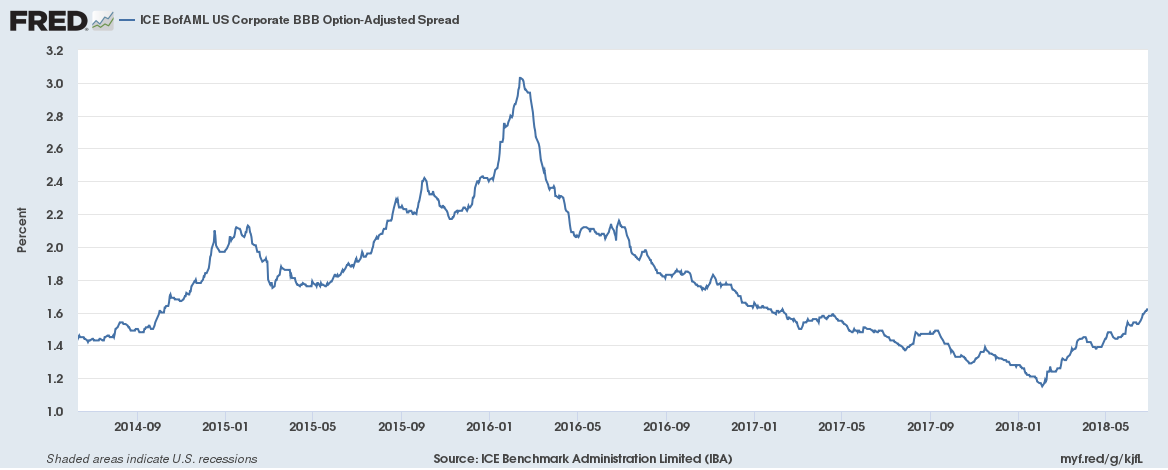
What several analysts now point to is the large and increasing percentage of BBB/BBB- in the investment grade universe. This is becoming a hot topic, as evidenced by the following snippets: From Almost Daily Grants June 26, “According to data from FactSet, investment-grade debt has been the worst performing major asset class year-to-date through June 21 with a 3.6% loss, trailing Treasurys (down by 1.4%), high-yield (green by 0.7%), stocks and commodities (both higher by more than 3%).”
Here’s a clip from Business Insider in April 2018: “The ballooning of BBB-rated debt as a share of the overall investment-grade bond market comes as U.S. corporations heap debt onto their already leveraged balance sheets. The outstanding value of BBB-rated debt is around 42.2% of the entire investment grade market, comparing with 26.1% in 2007.”
From the MacroTourist last week: “The past five months have been brutal to investment-grade credit investors. IG OAS has risen from 95 bps in late January, to 140 bps today. This is a big move for investment-grade bonds. It is an especially big move considering the fact that most other risk assets are not following suit.” He further notes that the ratio of Hi Yield to IG is the lowest it has been since 2009 (the yield spreads are converging).
From the FT June 29: “Investment-grade US corporate bonds recorded a second negative quarter in the three months to the end of June, marking the first back-to-back losses since the financial crisis, as the Federal Reserve raised interest rates and foreign buyers of corporate bonds retreated in the first half of this year.”
There was also a note from BofA citing some of the same concerns regarding European debt. From ZH (attributed to BofA): “Since the beginning of 2015 (PSPP started in March ’15) the size of the BBB-rated non-financial sector has grown from €450bn to €755bn (66%). Conversely, the size of the Euro high-yield market has shrunk from €310bn to €285bn over this period.” The ECB can buy investment grade debt, so high-yield issuers have a big incentive to squeeze onto the next rung higher on the quality ladder. But what happens in a recession with downgrades?
Regarding size of the markets, in 2008, when MBS was the problem, the amount of US mortgages outstanding was $10.61T, total Business debt was $10.66T and Corporate was $6.57T. As of Q1 2018, Mortgage debt outstanding is actually lower at $10.14T, total Business is $14.43T and Corporate is $9.06T. Of course, the elephant is Fed’l debt, from $7.38 to $17.08.
The broad concern is that there is a lot of debt teetering just above junk status, and perhaps rating agencies are not being as stringent as they should. With 2 consecutive quarters of negative returns in IG, and an increasing spread, the market is giving a pretty clear warning that probably shouldn’t be ignored.
Of course, another fragile spot is emerging markets. From BBG on June 29: “Asian high yield dollar bonds are set to post the biggest quarterly loss since 2013, with Chinese companies leading declines, as a heavy pipeline of new bond deals and rising defaults dented market confidence. Asian junk bonds are set to post negative returns of about 3.3% in 2Q after a loss of 1.1% in 1Q, making it the worst quarter since 2Q 2013…”
For a great summary of the quarter see this blog from Doug Noland
http://creditbubblebulletin.blogspot.com/
When looking back at emerging market strife in the late 1990’s, most charts don’t really reflect the same sort of disruption now as then. In late 1997 the Malaysian ringgit and Indonesian rupiah and India rupee crashed. In 1998 it was the Russian ruble (and related collapse of Long Term Capital Mgmt). In early 1999 the Brazilian Real plunged. In the current episode Argentina and Turkey have been standouts, and of course, several other countries have had to raise rates to stem capital outflows. On Friday Indonesia raised 7-day reverse repo 50 bps to 5.25. June 21, Bank of Mexico raised overnight rate to 7.75%. June 6, RBI raised repo rate from 6.0 to 6.25%. Rising rates and vulnerable currencies are headwinds to global growth.
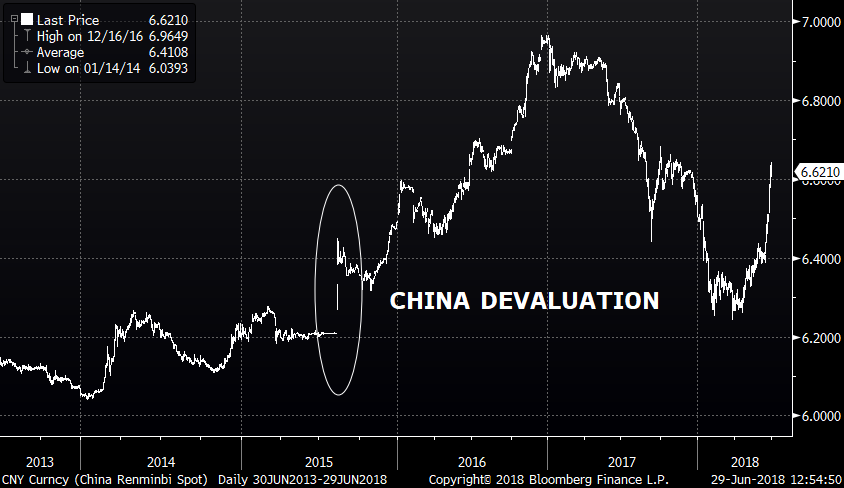
Many recall when the summer month trading lull of 2015 was jolted by China’s devaluation in August. However, as the chart below shows, this month’s decline in the yuan from 6.40 to 6.62 is around the same magnitude. Powell’s Fed is turning a deaf ear to growing imbalances, hesitant to ride to the rescue whenever market forces threaten financial asset prices. It’s a fine line.
Although several Fed Presidents like Bullard and Bostic have cautioned about hiking too quickly, Powell is more focused on the performance of the domestic economy. Williams has been silent. Quarles gave a speech last week about international financial linkages, but it was largely a vote of confidence in the FSB or Financial Stability Board. There has been discussion about the flatness of the curve, but for now the signal is being ignored. Core PCE prices finally hit the Fed’s target of 2% last week. Q2 growth was likely in the high 3% range. This Friday’s Employment report will show continued improvement in labor conditions with NFP expected 200k and Avg Hourly Earnings +0.3 mom and +2.8% yoy.
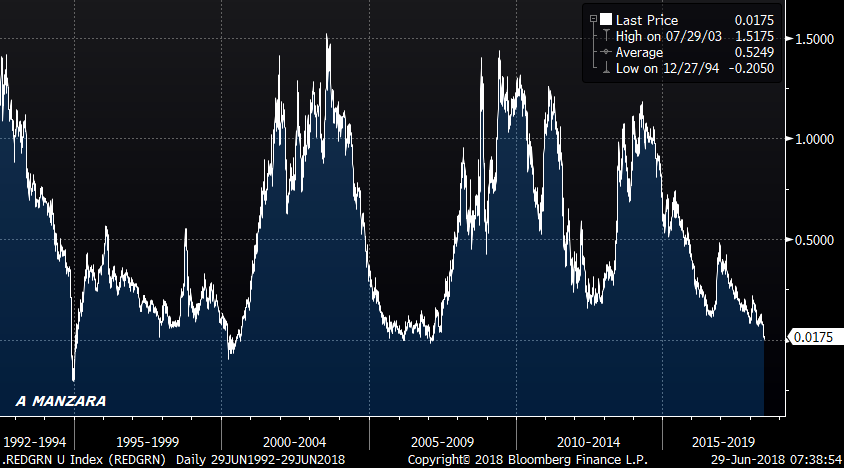
For curve traders, it really comes down to how close the Fed is to ending its hiking campaign. Most measures of the curve are at their flattest levels of the cycle. I have included below a chart of the red to green Eurodollar pack spread (2nd to 3rd year forward) which closed just barely positive on Friday at 1.125 bps. On a long term basis, this area appears to be a buy. But steepening really occurs when the Fed is DONE. At the end of 1994 it was the 75 bp hike in November to 5.5% that turned the tide (though there was another hike in Feb 1995). In 2000 it was the 50 bp hike in May to 6.5% that capped the move. In 2006 the cycle of 25 bp hikes at every meeting culminated in June, topping at 5.25%. This month’s hike put the Fed Fund target at 1.75 to 2.00, well below previous tops. While the market is indicating that the Fed is tight, it’s just not clear that the Fed itself is accepting that message. The result is that there are a lot of conditional steepeners that have been entered on the dollar curve, that is, buying near calls and selling deferred, usually with a long delta bias. My personal view is that the Fed will maintain its hawkish bias at least through a September hike. As of Friday, the August/October FF spread, which isolates the Sept 26 FOMC, is 18, or around 3 in 4 odds of a hike. EDU8 settled 9754.5, or 13 bps higher in rate that the EDM18 expiration. Because rates are much lower in this episode, I think greens are likely to be the pivotal part of the curve. June’s FOMC minutes will be released on Thursday, and may provide enhanced clues about the Fed’s outlook.
MON: ISM Mfg 58.3 from 58.7. Prices paid last was 79.5, expected 74.7 which was highest since 2011.
TUES: Factory Orders 0.0
THUR: ISM Service 58.2 and FOMC minutes***
FRI: NFP 198k from 223k; Rate 3.8%; AHE 0.3% and yoy 2.8%
O
| 6/22/2018 | 6/29/2018 | chg | |
| UST 2Y | 254.5 | 252.8 | -1.7 |
| UST 5Y | 277.2 | 273.3 | -3.9 |
| UST 10Y | 289.9 | 285.3 | -4.6 |
| UST 30Y | 304.1 | 298.8 | -5.3 |
| GERM 2Y | -66.5 | -66.5 | 0.0 |
| GERM 10Y | 33.7 | 30.2 | -3.5 |
| JPN 30Y | 70.7 | 70.6 | -0.1 |
| EURO$ Z8/Z9 | 35.0 | 32.5 | -2.5 |
| EURO$ Z9/Z0 | 1.5 | 1.5 | 0.0 |
| EUR | 116.56 | 116.83 | 0.27 |
| CRUDE (1st cont) | 68.58 | 74.15 | 5.57 |
| SPX | 2754.88 | 2718.37 | -36.51 |
| VIX | 13.77 | 16.09 | 2.32 |
https://www.zerohedge.com/news/2018-06-28/bank-america-spots-eu800-billion-cliff-fills-us-fear
May 21. First half is over….
–Second quarter draws to a close with a sigh of relief as stocks staged a modest bounce and the euro rose, after again holding 115 (3rd time in a month) as the EU summit cobbled together an agreement on migration.
–Everyone passed the Fed’s stress test and can dole out money to shareholders who can use it to bet on the next Blue Apron. Not so fast Deutsche Bank US, you’re being held back and have to re-take the remedial math class, or, as we used to call it ‘Jolly Numbers’
–Today brings Personal Income and Spending, both expected +0.4. Core prices expected +0.2 mom and +1.9 yoy. Late yesterday, today’s (week 5) TY 120.25 straddle traded 14/64’s ref 120-08; not expecting any early fireworks. Yields edged higher yesterday with tens up 2 bps to 284.6.
–Reports surfaced that General Kelly may exit the Chief of Staff role this summer. A sign of more unpredictability in policy? It seems as if other nations are always being forced to respond to blind-side proclamations from Trump. A natural counter strategy would be to get out in front and provoke the US first. Global politics have the potential to become more disorderly.
–WTI slightly higher this morning. Aug/Sept calendar spread settled $1.64, a difference of 2.2% for a one-month calendar. There have to be some pretty large losses associated with this move…
June 28. Further USD strength vs EM in the offing?
–Yields fell as stocks declined and oil surged to a new high. Ten year fell just over 5 bps to 2.826. In dollars, reds were +4.5 bps, greens thru golds were +5.5. The curve is completely flat from EDZ19 back to EDU22, with all settles between 9707.5 and 9705.5. Red/green pack spread edged to a new low of just 0.5 bp. Large trade: continued accumulation of EDH9 9700/9687/9675p fly for 1.75 in size of 50k (total ~175k). Also a large block sale 30k 2EU 9687p at 5.5 covered 9707. Prelim open interest sheets inexplicably show this as a new position with OI +32k.
–While US equity futures are trying to stabilize, SHCOMP made another new low and the yuan also at a new low 6.628. It’s not simply back and forth trade rhetoric that has afflicted China’s markets, but perhaps the hangover of dealing with malinvestment. Mexico election Sunday widely expected to result in AMLO win (Lopez Obrador), but possible reversal of economic reforms ahead. MXN stable for now having been in a consistent sell off for two months (mid-April to June). The WSJ notes that India’s rupee is also at a fresh low against the dollar.
–Vols slightly firmer in rates. New low in 2/10 (with new 2 year) of 32.6 bps. Position squaring in front of quarter end and the holiday week upcoming….
June 27. Submerging markets
June 26. China: It’s not you. It’s me
June 25, 2018. Stanching global liquidity and trade
-Trade jitters again as Trump proposes blocking Chinese investment in US firms with industrially significant technology. After key reversals last Thursday both Nasdaq and Russell are lower (along with ESU of course). Russell has been a leader to the upside, but a couple of closes below 1675 would target the 1600 area. SHCOMP also lower despite a telegraphed cut by the PBOC in RRR. Yuan making new low this morning. USD stronger across the board as Italy is pressing on migrant issues, helping to undermine the euro.
–In TY in both August and Sept options, the 120/122 call spreads are the largest long positions with over 125k in those strikes. TYU is just above 120 this morning having failed that level on Friday.
–The Telegraph’s Evans Ambrose Pritchard has a piece summarizing the BIS report: BIS fears snapback crunch as rising rates meet record global debt. “The stronger dollar and rising US rates together act a tightening tourniquet on world liquidity.”
–Not much of a change in rates on Friday, but a more pronounced downturn in stocks would likely cause reds and greens to lead an upside charge. The first three one-year spreads are Sept/Sept at 49.5, Dec/Dec at 35 and March/March at 23, essentially declining by 1/8% every 3 months forward. Though it currently seems unlikely, a shift in the first spread down into the 30’s would create a bit of a scramble to cover short exposure in midcurve calls.
June 24. Pin the tail on the Donkey
Starting with a micro theme this week, sparked by a couple of Eurodollar option trades. Last Wednesday there was a buyer of 50k EDM9 9687.5/9675/9662.5 put butterflies for approximately 1.7 bps (using a futures hedge). On Friday, the top put spread of this fly was bought in size of 100k at net premium 3.75 to slightly lower. Settles were: EDM19 9711.0, puts 7.25/3.75/1.75. The 9687.5/9675 put spread settled 3.50 and the put fly 1.50. These options expire June 17. 2019 so there are 357 days to go. Trades like this can be thought of as trying to ‘pin’ the final settlement based on Fed policy (though these might be a part of a larger strategy). With EDM18 having expired at 97.675 and the Fed in a quarterly tightening mode, one could just tack on 100 bps of Fed hikes over a year and forecast final settlement of EDM19 at 96.675. Therefore, the top put spread will fill out to 12.5 and the put butterfly will be worth 7.5. The only problem is that recent euro$ settlements have not moved in discrete 25 bp increments, as the table below shows.
| FOMC | UPPER | DAY AFT | LIBOR | PRICE | CONTRACT | |
| DATE | BAND | HIKE | SETTING | EQUIV | SETTLE | CHANGE |
| 12/14/2016 | to 0.75 | 12/15/2016 | 0.99317 | 99.0068 | 99.0057 | |
| 3/15/2017 | to 1.00 | 3/16/2017 | 1.15178 | 98.8482 | 98.8688 | 13.69 |
| 6/14/2017 | to 1.25 | 6/15/2017 | 1.26744 | 98.7326 | 98.7198 | 14.90 |
| 12/13/2017 | to 1.50 | 12/14/2017 | 1.60042 | 98.3996 | 98.3745 | 34.53 |
| 3/21/2018 | to 1.75 | 3/22/2018 | 2.28557 | 97.7144 | 97.7775 | 59.70 |
| 6/13/2018 | to 2.00 | 6/14/2018 | 2.33469 | 97.6653 | 97.6753 | 10.22 |
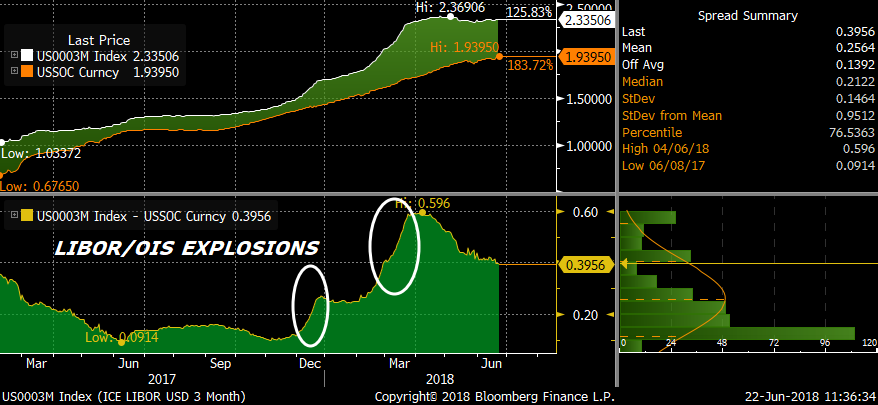
Over the five hikes shown above, the average move is 26.6 bps, but the variation per hike is pretty wide, from 10.2 to 59.7. This is, of course, due to volatility in the libor/ois spread, as the chart above shows. Nothing too special here, the trend is captured. We just can’t be too sure about relationships that used to be more stable. Going forward libor may not even be the benchmark rate.
In observing a few markets since Q4 of last year, this idea of somewhat elevated volatility jumps out. As a small example, consider the nearly 5% surge in the front crude oil contract just on Friday! Or look at the July Copper contract, which was under 3.00 in December, soared over 10% to 3.31 in January, broke down below 3.00 again in April, started June around 3.00, went to 3.30 in six sessions and is now back at 3.02. This is Dr Copper, supposedly the metal with a PhD in economics. A bit more like Jekyll and Hyde.
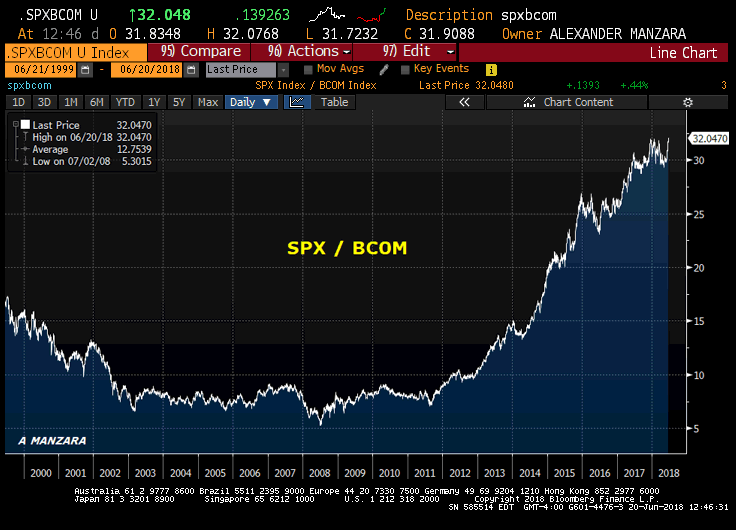
Where we do have strong trends over the past several years is in the realm of consistently appreciating financial claims on income streams supposedly derived from the real economy. For example, the increase in the value of stocks relative to commodities is represented in the chart of SPX divided by BCOM, the Bloomberg Commodity Index, up 6x from the low in 2008.
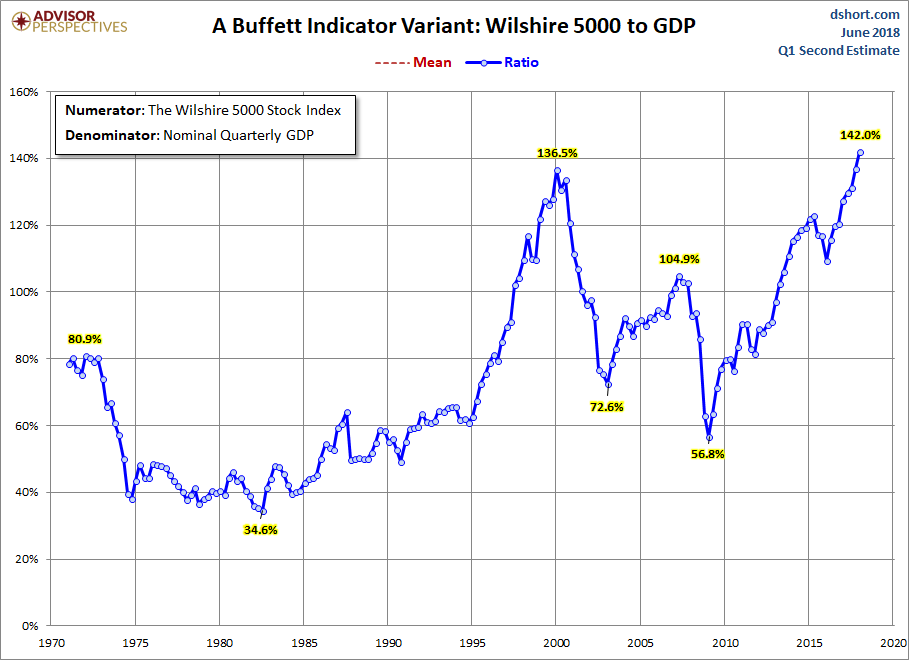
I also include a variant of one of Buffet’s favorite indicators, the value of stocks relative to GDP. This shows a new high using the Wilshire 5000 as the numerator. However, when using the Corporate Equities value from the Fed’s Z.1 report, the value of stocks is 133% of GDP, below the peak of 151% in the Nasdaq mania of 2000. CHART FROM DSHORT ADVISOR PERSPECTIVES.
https://www.advisorperspectives.com/dshort/updates/2018/06/22/market-cap-to-gdp-an-updated-look-at-the-buffett-valuation-indicator
In any case, the economy itself seems to be driven more by financial asset values than by productive investment. On the other hand, estimates for Q2 GDP are quite strong, with the Atlanta Fed GDP Now at 4.7% and the NY Fed at 2.87%. The case for continued near term hikes remains intact, even though the back end of the euro$ curve from EDZ19 forward is pinned flat. On the treasury side, 5/10 closed 12.7 bps and 10/30 at 14.2.
Not much in the way of news to finish out the last week of the first half. Durable Goods Wednesday and 3rd estimate of Q1 GDP on Thursday.
OTHER MARKET THOUGHTS/ TRADES
July option expiry on Friday saw the TY contract fall short of the 120 strike (TYU8 contract 119-26.5s and USU8 143-31). The 120 call strike in both August and Sept are peak open interest levels. Actually, the 120/122 call spreads are the position stand-outs. TYQ 120/122cs settled 25/64’s (29 and 4) with OI of 125k in each strike. TYU8 120/122cs settled 33 (43 and 10) with OI of 127.7k and 121.7k. The flattening curve, Trump’s tariff rhetoric and European issues driven by both Italy and Merkel’s future have tempered enthusiasm for the downside.
There was notable buying Friday in TUQ calls, for example a late buy of 25k TUQ 106.25/106.375c spd for 1/64. Max value is 8/64’s. There was also buying of the 106.125/106.375cs, which settled 2.0 (3.5 and 1.5). With a settlement of TUU8 at 105-275, the 106.125c (106-04) is about 12.5 bps out of the money and the 106.125/106.375c spd is about 12 bps wide; 2/64’s is ~ 1.5 bps. TUU8 DV01 is $41.60. August options expire July 27. Compare these call spreads with 0EN 9712/9725 call spread vs EDU19 9704.5. Settled 1.75 bps, 8 out of the money, expiring sooner on July 13. Perhaps TU has a slight edge due to flight into short treasuries and 2 extra weeks of time?
There was buying of EDU8 9762c (2.25s ref 9754.0) vs 0EU 9750c (2.0s ref 9704.5). There have been many trades that have piled into this sort of theme. Buy front calls near the money and sell deferred calls that are out of the money for close to even premium due to elevated call skew in mids. I wouldn’t exactly call the trade ‘crowded’ but I would say that if the front calls appear to be in play because of an iced Fed, the back end could have a monster rally as well. If the Fed has to stop it’s probably due to a big exogenous change.
| 6/15/2018 | 6/22/2018 | chg | |
| UST 2Y | 255.0 | 254.5 | -0.5 |
| UST 5Y | 279.7 | 277.2 | -2.5 |
| UST 10Y | 292.2 | 289.9 | -2.3 |
| UST 30Y | 304.6 | 304.1 | -0.5 |
| GERM 2Y | -61.8 | -66.5 | -4.7 |
| GERM 10Y | 40.3 | 33.7 | -6.6 |
| JPN 30Y | 70.6 | 70.7 | 0.1 |
| EURO$ Z8/Z9 | 37.5 | 35.0 | -2.5 |
| EURO$ Z9/Z0 | 2.5 | 1.5 | -1.0 |
| EUR | 116.09 | 116.56 | 0.47 |
| CRUDE (1st cont) | 64.85 | 68.58 | 3.73 |
| SPX | 2779.66 | 2754.88 | -24.78 |
| VIX | 11.98 | 13.77 | 1.79 |

