
June 21. Another 100 bps higher by next summer solstice?
June 20. Short market cycles
–Like every other market disturbance, this one, (Trump’s threat of another $200b tariffs to be levied on China) caused an immediate market dislocation that faded within 24 hrs. Russell index closed at its high and is at a new ath this morning. GE, which was the largest stock by market cap in 2001 at $400b, has been removed from the Dow. November soybeans plunged 67 cents on the China threat, but came back to close 9.11, down just 20 cents, and Corn was nearly unchanged by the end of the session. VIX ticked as high as 14.68 but ended 13.35.
–However USD is maintaining its strength and is at a new high. This morning, the PBOC notes that a cut in the RRR (reserve requirement ratio) might be appropriate as growth eases, thus cushioning financial conditions as SHCOMP sank yesterday by 4%.
–In US rates yesterday yields fell, with the green ED pack leading at +4.125 bps (reds +3.0). The ten year eased 3 bps to 289.3. Once again, the red pack to gold pack (2nd to 5th year) posted a new low of just under 3 bps. By the end of the day, EDZ20/Z21/Z22 one-year butterfly was at a new low (on the curve) at -3.5/-3.0. EDM0/EDM1 which was bought Monday for -0.5, closed -1.5. Positioning reflects continued fear of lower rates, for example there was a late buyer (roll) of 10k TYQ 120.5/121 c 1×2, paying ~5.5 for 20k of the 121 line. However, in ED midcurves there was selling of calls vs puts to take advantage of elevated skew.
June 19. Summer’s here, turn up the heat
June 18, 2018. Is the Fed too tight?
June 17. A Courtesy Nod to Economic Projections
-You try to gimme your money / you better save it babe / save it for your rainy day
Jimi Hendrix / Fire
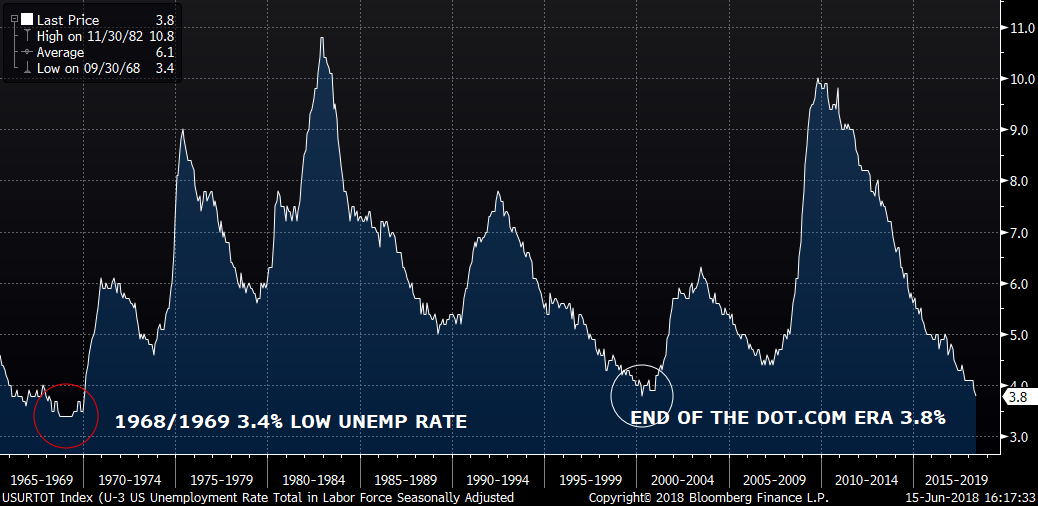
One of the interesting things about the Fed’s Summary of Economic Projections (SEP) released last week is the forecast for the unemployment rate. For the end of 2018 it’s projected at 3.6% and for 2019, 3.5%. Know when the last time unemployment was 3.6%? Nearly 50 years ago in 1969. So what else was going on in 1969? Woodstock. The iconic Woodstock poster echoes last week as Trump and Kim Jong-un hailed the white dove of peace and denuclearization. It’s astonishing that it’s been only 9 months since yields plunged to their lows (Sept 2017) as impending conflict loomed with N Korea. Now, that particular risk has evaporated and the market seems to treat other risks as if they too, will fade into the background.

According to the site thebalance.com, in 1969 the unemployment rate was 3.5%, GDP 3.1% and Inflation 6.2%. As recession ensued, in 1970 unemployment leapt to 6.1, GDP sank to 0.2% and inflation to 5.6%. Wikipedia has an interesting post on the recession of 1969/70. [With unemployment rate chart below]
The Recession of 1969–1970 was a relatively mild recession in the US. According to the National Bureau of Economic Research the recession lasted for 11 months, beginning in December 1969 and ending in November 1970 following an economic slump which began in 1968 and by the end of 1969 had become serious, thus ending the second longest economic expansion in U.S. history which had begun in February 1961 (only the 1990s saw a longer period of growth).
At the end of the expansion inflation was rising, possibly a result of increased deficit spending during a period of full employment. This relatively mild recession coincided with an attempt to start closing the budget deficits of the Vietnam War (fiscal tightening) and the Federal Reserve raising interest rates (monetary tightening).
Sound familiar? Deficit spending during a period of full employment corresponding with rate increases from the Fed? Perhaps better to save it for a rainy day…
The other feature of the Fed’s SEP was the increase in rate hike projections, to 2.4 by the end of 2018 (2 more hikes), 3.1 by the end of 2019, 3.4 by the end of 2020, and 2.9 longer term. While not outright dismissive, the Eurodollar curve isn’t fully buying into these forecasts. One-year forward EDM19 settled 9709, or 2.91%, less than 60 bps above the current 3 month libor rate. The following one-year calendars shave 1/8% every three months: EDU18/U19 settled 51, EDZ18/Z19 37.5 and EDH19/H20 25.0. Where the ED curve does give a nod of acknowledgment to the Fed is the idea that the longer term rate is BELOW the peak 2020 projection. The lowest ED contract out four years is, coincidentally, EDZ20 at 9693.5 or 3.065%, and for the next year, prices invert. EDU0/U1 and EDZ0/Z1 both posted new lows for all one-year spreads at -1.5 bps. I would also mention that in terms of the rest of this year, the July/January Fed fund spread, which captures hike odds, closed at 37 bps, essentially pricing a 50/50 chance of one or two more moves. All ED contracts from the 4 years between Dec’19 (96.96) to Dec’23 (96.91) are with 5 bps of each other, so just north of 3%.
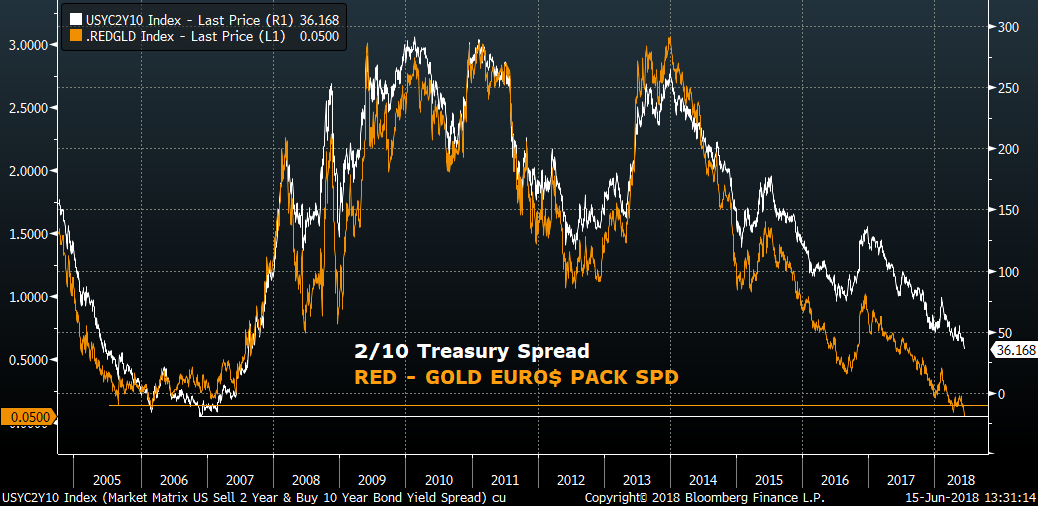
The longer end of the curve also flattened to new lows for the cycle. Below is an updated chart of the red/gold ED pack spread and 2/10 treasury spread. Red/gold (2nd year forward vs 5th year frd) is below the low of the last hiking cycle 2004/06. 2/10 closed at 37 bps, having been negative in 2006.
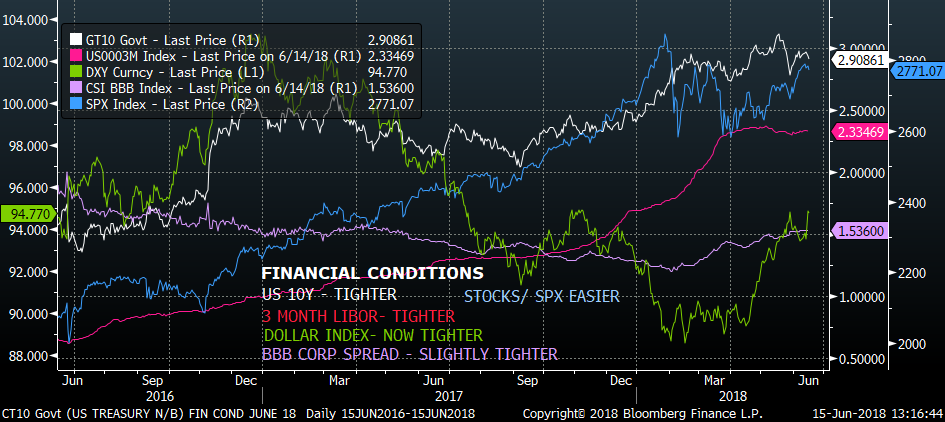
Over a longer timeframe, the Fed wants to prevent overheating and a surprise surge in inflation due to wage increases. Articles abound bemoaning the lack of skilled workers, and during the press conference Powell said that business contacts repeatedly identify labor shortages as an issue. The broader topic of financial conditions (championed by the NY Fed) is shown in the chart below. While conditions generally eased as Yellen’s Fed raised the FF target, more respect for tightening is being shown to Powell.
It might not be completely clear on the chart, but there are 5 lines. The short term rate, 3-month libor, has obviously shown tightening. Since last September the ten year yield has risen by 90 bps, also tighter, and a notable change from Yellen. While fairly modest, the spread between BBB corporates and treasuries has also widened since Powell took over. The dollar index has surged in Q2, leading to tighter conditions, especially for Emerging Markets. Odd man out is stocks, blithely ignoring these other factors.
Investors have been paid to fade every risk from Brexit to Trump’s election, to escalation of armed conflict, to trade wars. However, the back end of the euro$ curve and skew favoring calls is an indication of unease with the roadmap going forward. Indeed there was heavy buying of TY calls over the past week, and on Friday commodities took a tumble. On the political front there’s a chance that Merkel could be bounced as chancellor this week. Pressure in Emerging Markets threatens to boil over with EEM and EMB at new lows for the year. Ditto for Shanghai Composite, off over 15% from the high in January. Week over week US yields were little changed, SPX was exactly unchanged, and VIX rolled marginally lower. Sometimes it’s not the week that EVERYONE knows could be a big one, but the one where no one expects anything. Seasons change; summer solstice on June 21.
June 15. Eurodollar curve inverts: 2020 to 2021 contracts
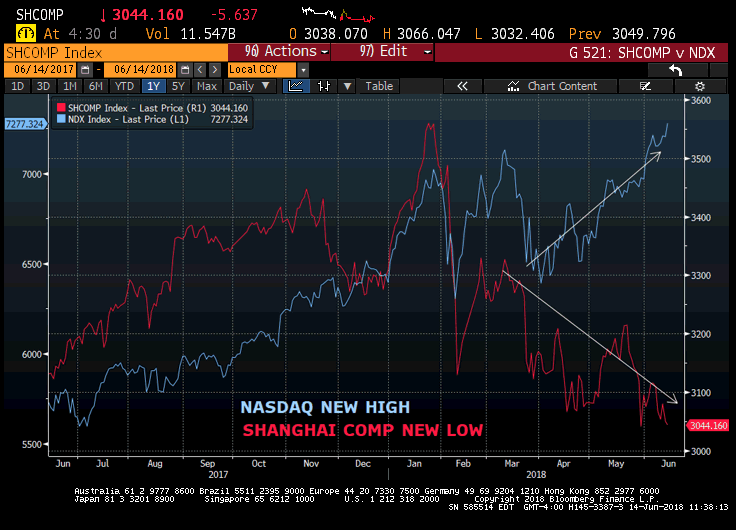
June 14. Nasdaq vs Shanghai Comp
June 14. The Fed’s ‘America First’ Policy
-As advertised, the Fed raised the FF target range by 25 bps, and IOER by 20 bps. The statement was altered to indicate decreased accommodation. In terms of SEP, FF in 2018 were projected to end 2018 at 2.4 vs 2.1 in March, and Core PCE went from 1.9 to 2.0, while PCE went from 1.9 to 2.1. The initial response was a flatter curve and sell off in rate futures; 2/10 treasury spread marked at 40.5 and 5/30 at 25.5 shortly after the announcement, and 39.9, 26.4 at futures settlement, with 2/10 at a new low for the cycle Red/gold pack spread settled 10.375, approaching the low of 8.25 on August 17. As mentioned yesterday, the low in Feb 2006 (the last hiking cycle) was 10.25. And, as EDM8 expires on Monday, if we use EDU19 and EDU22 as the pack starts, red/gold closed 7.25. It’s not quite inversion, but it’s getting closer. Late in the day there was a 20k block sale of EDZ9/EDZ1 at 4.0 bps (it had settled 4.5). The ten year yield was up only 2 bps to 2.977.
–As Powell announced press conferences after every Fed meeting beginning in January, off-quarterly FF spreads saw decent action. Oct/Nov FF spread went from 2.5 to 1.0 on heavy sales as odds for a Nov 8 hike fizzled, while Jan/Feb traded up to 4.0, settling +0.5 at 3.5. While the ‘dots’ indicate 2 more hikes into year end, EDU8 9737.5 puts were still offered at 0.75 late yesterday with EDU8 9750 bid. I would also note that July/Jan FF spread, which should capture the ‘two more hikes’ scenario, are less than fully embracing that outcome, having settled at 36.5. This, in spite of Powell characterizing the economy as “very strong” and noting widespread comments of skilled labor shortages.
–Today brings the ECB and discussions about the end of bond buying. So who is going to buy Italian bonds?
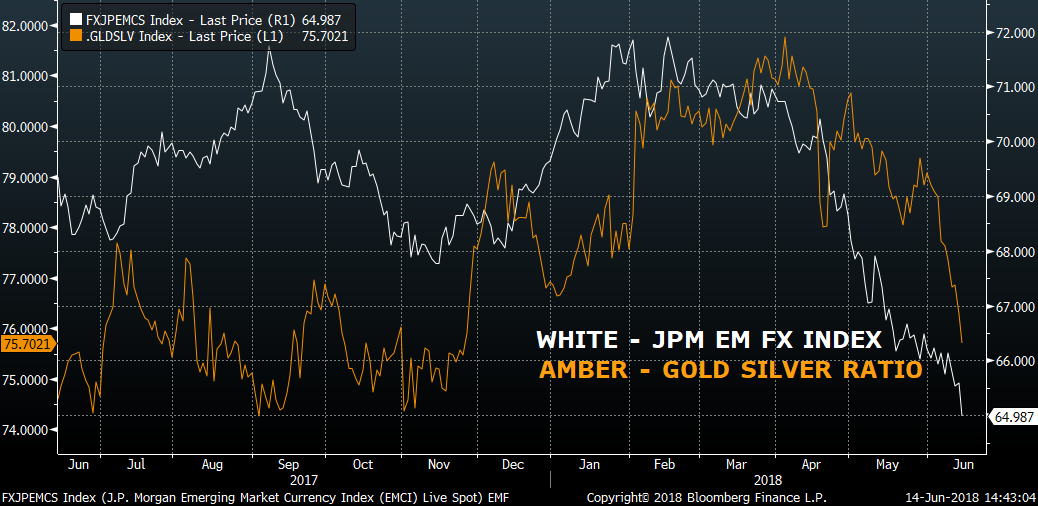
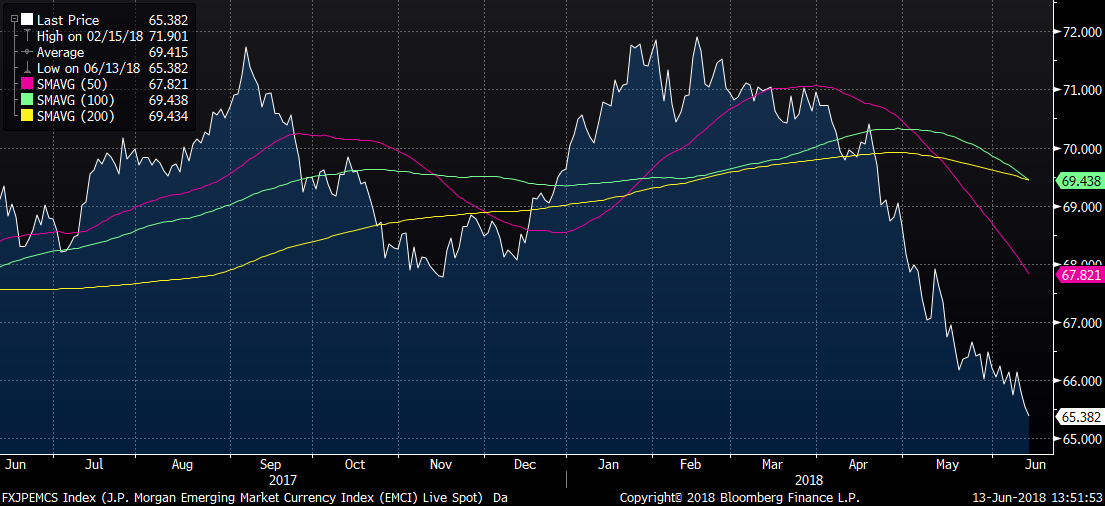
–In terms of tightening dollar liquidity, a couple of charts below relate to Emerging markets. At the top is EMB, the Emerging Market Bond etf, which closed at a new low. Beneath that is JPM EM FX Index, which is also at a new low. Note as well that even though the PBOC did not follow the Fed with a rate increase, the Shanghai Comp is at new lows for the year. Since making a high with Nasdaq in late Jan, SHCOMP and Nasdaq have completely parted ways. Will EM stress spill over into US markets? For now, Powell’s on the America First playbook, focused on the domestic economy.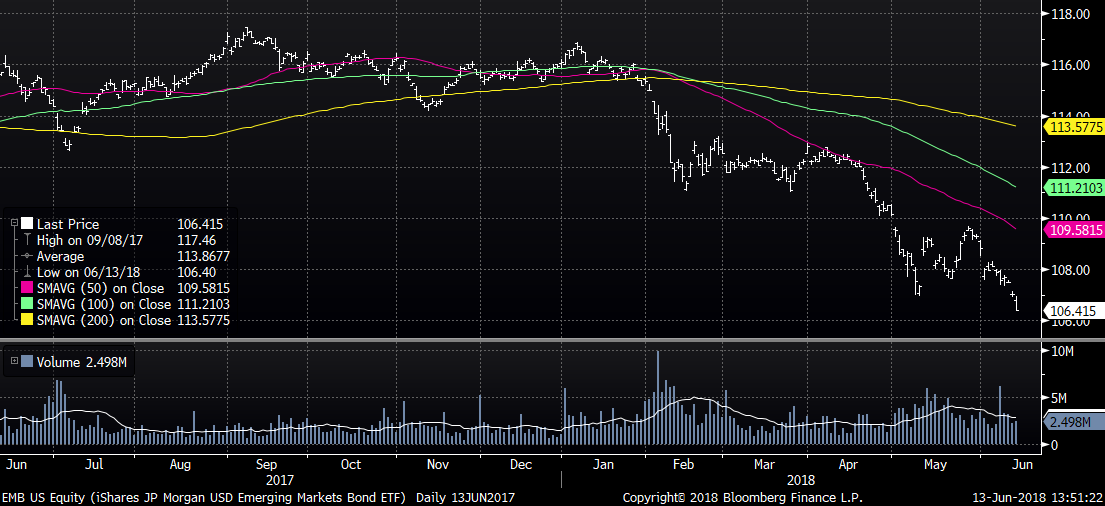
June 13. FOMC…. a bearish hike?
–Today brings the FOMC announcement, with near 100% expectation of a rate increase. Focus will be on the change in wording, perhaps to something like “the stance of policy remains MODESTLY accommodative.” Reuters cites Goldman in this snippet:
The last time such a change occurred was in September 2005 when rates were raised from 3.50 percent to 3.75 percent, “into the range of (neutral) estimates” given by Fed staff at the time, Goldman Sachs analysts noted.
The phrase “policy remains accommodative” was merely removed, with no substitute language or explanation.
[Note that the move to 3.5% at that time was about halfway through the hiking cycle]
–The same might occur here, with the line “…FF rate is likely to remain, for some time, below levels that are expected to prevail in the longer run” removed entirely. I think this meeting will also incorporate a rise of only 20 bps in IOER. However, the projection ‘dots’ may be a bit more bearish, with the 2018 end-of-year projection moving to 2.2 or 2.3. The inflation projection could move higher as well.
–In another twist, late yesterday it was reported that Powell is thinking of having press conferences after every meeting, which caused an immediate bid in odds for hikes at non-quarterly meetings. For example, there was a large buyer of Jan’19/Feb’19 FF spread which traded up to 3.5 but settled +0.5 at 3.0. Same with Oct’18/Nov’18 (meeting on Nov 8), which traded up to 3.0, settling +0.5 at 2.0. Overall, I think it’s likely to shake out as a hike with a more bearish tilt. If so, pressure on emerging markets may ratchet slightly higher, and the curve may flatten a bit more.
–A few quick notes from yesterday’s action: buyer of 50k EDN8 9750p for 3.0; open interest increased by 25k, EDU8 settled 9751.5. Large new buyer of TYQ 120c which settled 27 vs 119-13, with new open interest of 37k. Yields were little changed on balance, but I would also note that blue midcurve straddles are now nominally BELOW greens. About a month ago, blues traded at a premium of 2.5 to 3 bps. Example, 2EZ 9687.5^ settled 52.5 and 3EZ 9687^ settled 52.0. A new buy of 36k 2EU 9700p for 17.5 (17.75s ref 9695) might have been a factor. In any case, taken together, large trades and small adjustments in spreads indicate a bias toward flattening.
–PPI expected +0.3 with yoy Core +2.3. Yesterday’s NFIB small business optimism was 107.8, record high, through the 2004 high of 107.4.

