June 11. Receding risk in Italy meets treasury supply
–Three and ten year treasury auctions today. Yields edging slightly higher this morning after ending nearly unchanged Friday, but implied vol had a powerful bid going into Friday’s close, into what BAML is calling the most important week of the year. As an example, on June 4, 0EZ 9700 was 36.5 vs 9702.0. On Friday against the same futures level it settled 39.0 and was well bid at that level after futures settlement.
–G7 lived up to its advanced billing as G6 + 1, but the euro has strengthened this morning as Italy’s economy minister Tria has vowed to stay in the euro and cut debt (also helping equities). Now we move to the theatrics of the Trump-Kim summit.
–On the eurodollar curve, green/blue pack spread settled at just 2.25 bps. Greens are the third year out, (starting June 2020) and blues are the fourth (starting June 2021). So as Trump’s term draws to a close, the market is forecasting economic malaise? Perhaps that’s not the exact interpretation, but for whatever reason the back end of the curve is remarkably flat going into Wednesday’s FOMC. EDH20 is 9700 and EDH22 is 9694.5. As the Fed hikes Wednesday and brings Fed Funds approximately equal to the rate of inflation, the prospect of inversion appears closer. However, a negative reaction by emerging markets (perhaps impacting global equities) could diminish the market’s perception of forward hikes, even as the Fed vows to continue with gradual tightening.
June 10. Dollar Liquidity
“The upheaval stems from the coincidence of two significant events: the Fed’s long-awaited moves to trim its balance sheet and a substantial increase in issuing US Treasuries to pay for tax cuts. Given the rapid rise in the size of the US deficit, the Fed must respond by slowing plans to shrink its balance sheet. If it does not, Treasuries will absorb such a large share of dollar liquidity that a crisis in the rest of the dollar bond markets is inevitable.” RBI Governor Urjit Patel in a June 3, FT op-ed
Days later, Bank of Indonesia Governor Perry Warjiyo echoed the same sentiments. Several emerging markets have found it necessary to raise rates in order to deal with capital outflows, including India and Indonesia. We’ve already encountered turmoil in Argentina and last week it was Brazil’s turn to roil markets, with the Bovespa having plunged 14% in the past couple of weeks.
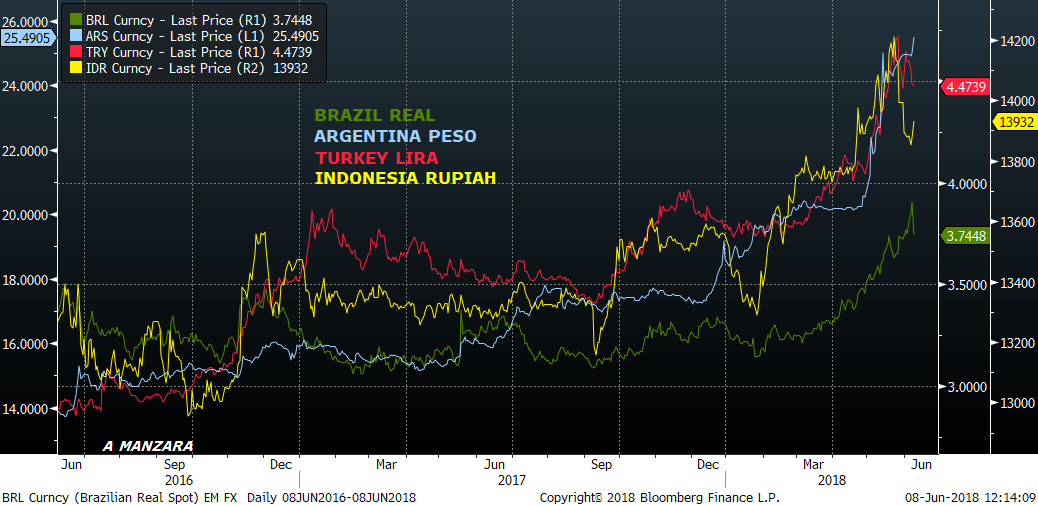
Correlation is not necessarily causation, but the chart below shows several currencies that have come under pressure, and it appears as if the damage has mostly occurred since the start of the year, with the new tax package and associated repatriation. As the USD generally weakened throughout 2017, it was good for emerging markets. The rally in DXY starting in April exacerbated declines in EM currencies, and now appears to be causing substantial stress. In mid-May Fitch warned about EM vulnerability due to high levels of debt.
Patel didn’t mince words, warning of potential crisis. This week, the US treasury auctions 3’s, 10’s and 30 year bonds on Monday and Tuesday, in size of $68 billion. Of this amount, $44 billion is NEW borrowing. In May’s auctions, the new cash raised from the same maturities was $34 billion. At that time I had expected a significant concession in order to absorb the supply. However, the rise in yields didn’t occur before the auctions, but rather afterwards in mid-May, and the same pattern could easily ensue this time, (with the FOMC and ECB meetings providing additional complications). Clearly, increased treasury supply is absorbing dollar liquidity, but in a speech May 8, Powell more or less dismissed the Fed’s influence on EMEs, and noted that the Fed had been quite transparent regarding intentions. From the speech, “Much of the discussion of the spillovers of U.S. monetary policy focuses on their effects on financial conditions in emerging market economies (EMEs). Some observers have attributed the movements in international capital flowing to EMEs since the Global Financial Crisis primarily to monetary stimulus by the Fed and other advanced-economy central banks.4 The data do not seem to me to fit this narrative particularly well.”
Let’s backtrack for one second to see where yields were prior to the last 3,10, 30 auctions. On Friday, May 4, I marked 5’s at 2.78%, 10’s at 2.944 and the 30y at 3.114%. On the week just ended, 5y was 2.777, 10y 2.937 and 30 yr 3.082, nearly the exact same levels. Will the extra supply translate into higher yields? Maybe not. Perhaps the added stress on EM simply creates a situation where there’s more demand for safe haven assets. Continued pressure on Italy translates the same way. In some ways it has seemed as if US equities, particularly big tech, had been the beneficiary of safe haven flows even though such rallies were normally referred to as ‘risk-on’. But given Trump’s snub to the G-7 communique and increased trade rhetoric regarding autos, it’s likely that equity markets will take a step back early in the week.
When the Fed hikes on Wednesday, the Fed effective is likely to be extremely close to the rate of inflation. Through May, the Fed Fund effective rate was 1.70%, so even if the IOER is raised less than the 25 bp FF target, FedEff will be closing in on 2%. As telegraphed by Brainard on May 31, the Fed is likely to alter ‘stale’ language in the statement, which had previously read, “…the federal funds rate is likely to remain, for some time, below levels that are expected to prevail in the longer run.” This line may be removed entirely, with additional modification to this phrase: “the stance of monetary policy remains accommodative…” to indicate a more neutral posture.
The risks are that the dots will be revised up and that inflation projections could be inched higher. In Dec 2017, the 2018 FF projection was essentially for three hikes to 2.1% with a further rise to 2.7% in 2019. In March of this year, the 2018 projection stayed at 2.1, but 2019 moved up to 2.9. In many ways, these forecasts are related to the EDZ18/EDZ19 euro$ calendar spread. In Feb through March, EDZ8/EDZ9 spread ranged between 30 and 37 bps. The high close in May was 41.0 and now it’s back at 34.0. The red/green euro$ pack spread in March was around 14 bps just before the FOMC meeting and is now just above 8. I think there’s a chance that the 2018 FF projection could move to 2.2 or 2.3. Coupled with a change in language signifying less accommodation, this could result in a flattening of the very front end of the curve and might also be perceived as additional risk for capital outflows from EM.
The Fed released its Flow of Funds Z.1 report last week. One interesting statistic is noted by Doug Noland who writes the Credit Bubble Bulletin.
Household Net Worth (Assets less Liabilities) surged $1.028 TN during Q1 – surpassing $100 TN ($100.77 TN) for the first time. Household Net Worth inflated $6.630 TN (7.0%) in four quarters and a stunning $13.959 TN (16.1%) the past two years. Household Net Worth-to-GDP, a key stat in Bubble Analysis, ended Q1 at a record 505% of GDP. For comparison, this ratio closed the seventies at 342%, the eighties at 378%, the nineties at 445% and 2007 at 459%. A bonus stat: Household Net Worth ended Q1 about 50% higher than the peak from Q2 2007 ($67.744 TN).
I am not quite sure how to think about net worth being 5x as large as GDP. How is it that ‘wealth’ grows so much more rapidly than ‘income’? I think that might make sense if productivity was extremely strong, but that hasn’t been the case. In the end, wealth must boil down to the present value of the future stream of earnings or of benefit, so this statistic just seems to be another manifestation of a discount rate that is currently quite low. A low discount rate makes balance sheets look more robust than they might actually be. Is the tide about to go out? Perhaps, we’re about to re-visit our underlying assumptions, and head for, as Anthony Bourdain’s series was aptly named, Parts Unknown.
I hadn’t seen much of that particular series, but I did watch an episode where Bourdain visits West Virginia coal country (link below) and transforms his own set of biases.
https://www.dailymotion.com/video/x6inwh4
“Here in the heart of every belief system I’ve ever mocked or fought against, I was welcomed with open arms, by everyone. I found a place both heartbreaking and beautiful, a place that symbolizes and contains everything wrong and everything wonderful and hopeful about America.”
OTHER MARKET THOUGHTS
In Brainard’s recent speech, she noted risks associated with Italy, Emerging Markets, Trade. However, until those risks actually spill over, the domestic economy appears quite strong, with increasing inflation trends and solid labor metrics. So the Fed is likely to maintain its steady course, which means continued quarterly hikes. In the short term, as alluded to above, I think that’s bearish for the front end with an additional chance of increased funding pressures.
Implied vol was extremely well bid into the close of Friday’s session. Perhaps not unexpectedly as we have G7, N Korea, Central bank meetings and US inflation data this week, along with auctions. ED straddles were up 1-2 bps Friday. For the sake of comparison, EDU8 9750^ settled 14.0 on Friday from 12.5 on Thursday. On May 16 it settled 13.0. EDZ9 9712^ settled 47.5, and on May 16 the EDZ9 9687 atm straddle settled 47.0. So in the past 3 and ½ weeks short premium trades aren’t paying. Certainly this is partially due to the near term calendar, but the market may be giving more weight to tail risks in the second half of 2018. If this latter idea is correct, then VIX back down to 12.2 is misguided.
| 6/1/2018 | 6/8/2018 | chg | |
| UST 2Y | 246.5 | 249.2 | 2.7 |
| UST 5Y | 273.6 | 277.7 | 4.1 |
| UST 10Y | 289.1 | 293.7 | 4.6 |
| UST 30Y | 304.5 | 308.2 | 3.7 |
| GERM 2Y | -62.8 | -65.1 | -2.3 |
| GERM 10Y | 38.6 | 44.9 | 6.3 |
| JPN 30Y | 71.4 | 70.9 | -0.5 |
| EURO$ Z8/Z9 | 31.5 | 34.0 | 2.5 |
| EURO$ Z9/Z0 | 6.0 | 5.5 | -0.5 |
| EUR | 116.59 | 117.71 | 1.12 |
| CRUDE (1st cont) | 65.81 | 65.74 | -0.07 |
| SPX | 2734.62 | 2779.03 | 44.41 |
| VIX | 13.46 | 12.18 | -1.28 |
https://www.ft.com/content/e193381a-64c1-11e8-bdd1-cc0534df682c
June 8, Wile E Coyote
June 7. US Big Tech the beneficiary of safe haven flows?
–Rates pushed higher Wednesday with the US ten year yield up 5.7 bps to 297.4 as stocks soared, with the ECB signaling intent to discuss an end to bond buying at next week’s meeting. Red through gold eurodollar contracts settled -4.5 to -5.0. Implied vol up across the board as rates rose, with the G7 starting Friday, the FOMC meeting Wednesday, followed by the ECB. According to some analysts, the hard stance by the ECB is meant as a pointed signal to Italy. Although the euro has had a moderate rally the last couple of days, it almost feels as if the US tech sector is the true beneficiary of global ‘safety’ flows, with the Nasdaq making new highs, having jumped 4% in the past week. US fixed income is being weighed down by QT and treasury supply, with the added bearish outlook by the ECB. EDM9 is down over 30 bps from the high print just six sessions ago. With just over a week until midcurve June expiration, 0EM 9712^ settled 9.0, 2EM 9700^ 11.0 and 3EM 9687.5^ 11.5.
–Worth noting as well that copper has had a blistering rally, with HGN7 rising from 3.06 to 3.28 in a week.
–Today’s news includes Jobless Claims expected 220k and Consumer Credit $14b. The Fed also releases the quarterly Z1 report which will likely show a new record high in Household net Worth even though stocks were flat to slightly lower over Q1. This report also summarizes debt levels and flows of the various sectors.
–Large trade yesterday includes a new buyer of 25k EDU8 9750/9737p 1×2 (3.0s) vs sell 9775c (1.5s). EDU8 settled 9752.5.
June 6. Buffet, “But I own Apple”
–Quiet session Tuesday. Early news that the ECB may debate QE exit at next week’s meeting, along with (related) weakness in Italian banks caused the eurodollar strip to erase Monday’s losses (+5.0) but that bid faded as the day went on and ED contracts mostly settled +2.0 to +2.5 (reds through golds). From this morning (RTRS)
“Robust growth is making the central bank increasingly confident that inflation is on its way back to target, ECB chief economist Peter Praet said on Wednesday, increasing the likelihood it may use a meeting next week to reveal more about the end of its bond-buying program.” EUR is at a new recent high, but this rally is tepid and likely to stall soon.
–Mexican peso made a new low as Kudlow said Trump was thinking of splitting NAFTA negotiations. After the election, MXN had traded just over 22.00, and then strengthened to 17.50 one year ago. Yesterday the high was 20.47, weakest since February 2017 and above the 0.618 retracement (20.29). This adds to perceptions of stress in emerging markets related to dollar-denominated debts and increased US interest rates.
–I mistakenly thought Productivity and Unit Labor Costs were released yesterday, but they’re slated for this morning, expected +0.5 and ULC +2.8%.
–ESM/ESU roll traded as low as 3.90 yesterday, a new low for the cycle. Volume in the roll was about 38k, about 10% complete so far.
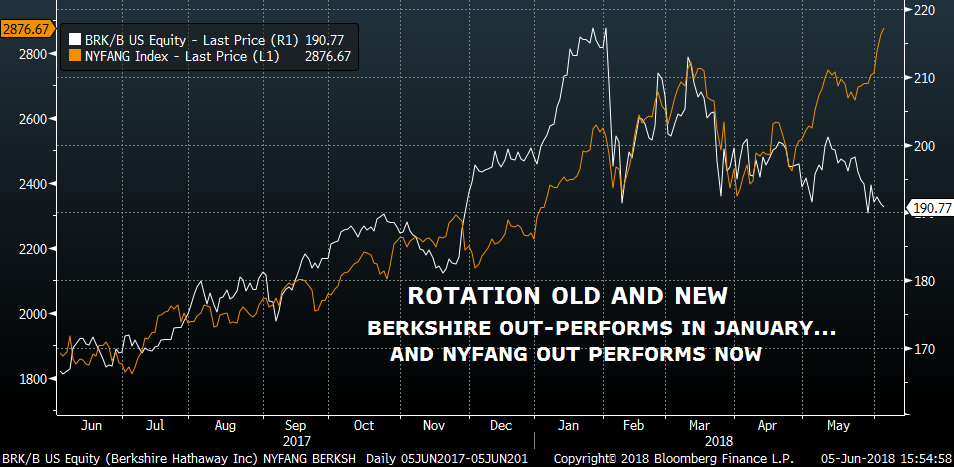
–Remember when they said Buffet was all washed up during the dot.com era, because he didn’t understand the new-fangled technology companies? Here we go again. Berkshire near the low of the year and NY Fang index at new highs.
June 5. Italy fades
–Stocks continue to climb and rates continue to unwind lower as the market discounts spillover from Italy’s problems. Red thru gold eurodollars closed down 5 to 5.5. Green June (EDM0) is down more than 30 bps from last week’s high. The ten year yield was up 4.2 to 293.3. However, given light news this week, implied vol declined, with ED straddles down 0.5 to 1.5 bps.
June 4. Calm after Italy’s storm
–Starting the day with the Russell at new ath. Yields are a bit higher after having risen on Friday’s session, a result of the solid jobs report and buoyant stocks. NFP better than expected 223k with the unemp rate at just 3.8% and yoy earnings +2.7%. Today’s news includes Factory Orders expected -0.4%. How can there be so many kids panhandling on every city block downtown Chicago with a 3.8% rate?
–Once again there is a ‘mini-inversion’ on the ED curve, as EDZ0/EDH1 settled -0.5. As mentioned over the weekend, the Fed (Brainard) is somewhat dismissive of the flattening curve’s message. They’re not killing the messenger, just choosing to explain it away. The IOER tweak may not be enough to prevent a full-on inversion by year end if there are two more consecutive hikes. On the other hand, non-US considerations including Italy and EM stress, may convince the market that the hike cycle will have run its course by year end, in which case long dated supply will become the dominant theme.
June 3 (Weekly). The China Syndrome
Political turmoil in Italy sparked a big risk-off reaction at the start of last week, but by late Friday things stood pretty much as they were the previous Friday. The largest net change on the US curve was the 30 yr yield, which fell just under 5 bps to 3.045%. If one had no other information than the weekly changes shown on the table at the bottom of this note, he might surmise that the $2 drop in crude oil diminished inflationary threats, causing a slight bull flattening move while providing support for equities. Indeed, stocks ended the week with a powerful rally. The Russell 2000 closed at new all-time highs, while the Nasdaq is within 1% of a new high, having surged 1.5% on Friday alone. VIX closed the week at 13.46 from 13.22 the previous Friday. With Italian banks and Deutsche Bank (added to a list of problem banks in the US) under heavy pressure amid worries that euro-skeptics are gaining political power, the euro actually closed up slightly on the week. This, in spite of solid, dollar-supportive data. Friday’s payroll number featured yoy Average Hourly Earnings +2.7%, while Thursday’s Mfg ISM included the highest Prices Paid component since 2011. There was also a rather bearish speech from former Fed dove Lael Brainard (more on that later). In fact, on a technical basis, the euro tested the 50% retrace from the 2017 low of 1.0341 to Q1’s high of 1.2555. 50% is 1.1448 and Tuesday’s low was 1.1510; late Friday it was 1.1659, up from last week’s 1.1645.
With the sweep of broad perspective, our current environment might be framed as the age old paradigm of man vs machine, or ‘simple model’ vs ‘nuanced human decision making’. The machine takes the data as presented. A new low in 2/10 treasury spread at 42 bps, combined with a drop in oil prices derives compressed term and inflation premium. Therefore, buy stocks. Technical level held in EURUSD, buy euro. The intricacies of Italy’s politics are unimportant inputs in the equation. This is one of the main themes in Michael Lewis’ fascinating book The Undoing Project, where time after time, in sports, in medicine, in battle, in trading, a simple model provides better results than expert human analysis and guidance. It’s an idea the Fed has constantly fought against.
This week I watched The China Syndrome a classic 1979 movie about a nuclear power plant accident. The title refers to a core radioactive meltdown event which theoretically could blow right through the planet to the opposite side, China. All of today’s themes are touched upon in this movie: sexism, technology vs human intervention, corporate greed, fake news. The power plant control room, where Homer Simpson works, is full of analog dials, manual switches, and whirring tapes. There’s one scene where the controller has to tap the window of an instrument to unstick the mechanical needle which identifies a crucial piece of data, the water level surrounding the core. This movie was made even more famous by the fact that its release was just a couple of weeks before the Three Mile Island nuclear plant accident in PA. It’s no Barbarella, but it does star Jane Fonda as the sexy human-interest reporter trying to transition to ‘hard’ news. Her camera news team is doing a routine feature story on nuclear power at the plant, when they witness (and clandestinely film) an accident. The technology transformation has been incredible, on many levels.

The machines and models have also, of course, transformed the trading business. In our movie example, the shift supervisor panics about overloading the plant for fear of catastrophic mechanical failure. On Tuesday, the CME handled the overload flawlessly, trading a record 51.9 million contracts. The CME press release, linked below, notes that “six of the company’s ten highest volume days have occurred during 2018 to date.” No China Syndrome. We had a tremor in the system early in the week, but no ‘flash crash’. As Jack Lemmon says (early in the movie) “the systems work.”
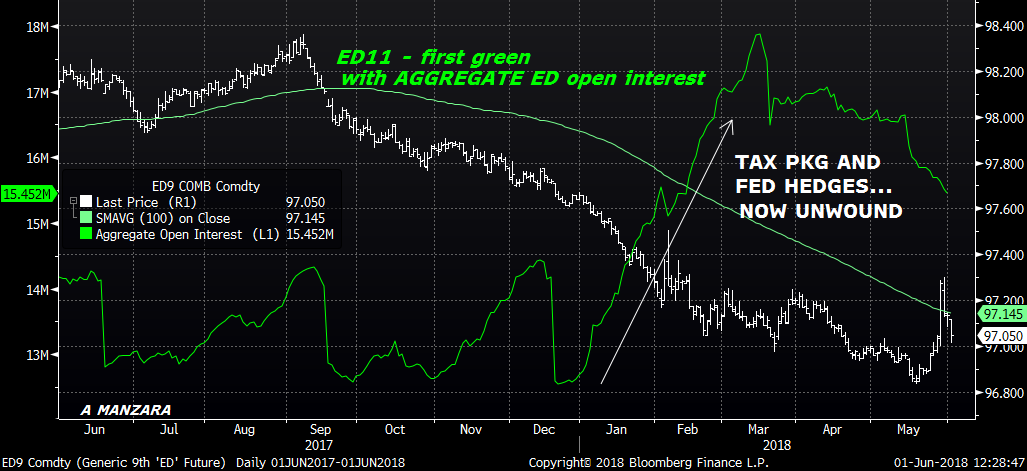
However, open interest in eurodollars, and in other interest rate products, suggests that the system is powering down to some extent. The chart below shows one representative Eurodollar contract, the 9th quarterly or first green, now EDM20, overlaid with aggregate open interest in all ED contracts. At quarterly expirations, there’s typically a large drop in open interest, which is then replaced with new hedges/positions. From the start of 2018 as the tax package was passed and estimates of forward growth were ratcheted up, ED open interest screamed higher, moving from 12.5 million to nearly 18 million, a jump of nearly 50%. New positions were placed on the prospects of a more aggressive Fed spurred by sustained, fiscally-driven growth. However, after the March expiration, open interest fell and rather than re-building, it has continued to decline to more typical levels. The same phenomenon, to a lesser extent, is apparent in treasuries. My interpretation is that the market lost the concern that rates would continue to press higher, and views fiscal stimulus as one-off. This is corroborated by the flattening in the back end of the curve, where the red/green euro$ pack spread ended the week at 8.625, right where it started the year (with an intervening high just shy of 22). Green/blue ended at 2.5. The rally of the past two weeks was particularly unkind to shorts, who ran for the exits.
Brainard’s speech (link below)
Lael Brainard is one of the last of the old guard on the Fed board. She had been dovish during Yellen’s tenure, but has recently modified her outlook. In her speech last Thursday, she said the economy is growing above trend and that she expects tailwinds from fiscal stimulus in the second half and beyond, concluding that “continued gradual increases in the federal funds rate” are appropriate and will move “after some time, modestly beyond neutral.”
She briefly talks about risks, specifically citing ‘political developments in Italy’ and further says ‘some emerging markets may find conditions more challenging.’ Indeed Italy 5yr CDS zoomed up in May from 70 to 270, nearly catching up to Turkey, which reached just under 300 bps at the end of May. Italy ended the week at 219…still rather elevated. For the most part though, risks are glossed over in a short paragragh.
She spends more time on the relatively flat curve and cites a decline in term premium, which was partially engineered by the Fed, as one of the main culprits for the flatness. In other words, Brainard more or less dismisses signals from the curve at present. A week and a half in front of June’s FOMC she notes “…I believe that the forward-guidance language in the Committee statement that was introduced a few years ago that ‘the federal funds rate is likely to remain, for some time, below levels that are expected to prevail in the longer run’ is growing stale and may no longer serve its original purpose.” This is a clear signal that language is likely to change at the June meeting. Ironically, such a change may actually provide added pressure on the curve.
News is fairly light this week with Factory Orders and Durables on Monday, ISM Serices Tuesday. On Thursday the Fed’s Z.1 report comes out which updates Household Net Worth and Debt levels of the various sectors.
| 5/25/2018 | 6/1/2018 | chg | |
| UST 2Y | 247.8 | 246.5 | -1.3 |
| UST 5Y | 276.3 | 273.6 | -2.7 |
| UST 10Y | 293.3 | 289.1 | -4.2 |
| UST 30Y | 309.3 | 304.5 | -4.8 |
| GERM 2Y | -62.2 | -62.8 | -0.6 |
| GERM 10Y | 40.6 | 38.6 | -2.0 |
| JPN 30Y | 73.6 | 71.4 | -2.2 |
| EURO$ Z8/Z9 | 33.5 | 31.5 | -2.0 |
| EURO$ Z9/Z0 | 7.0 | 6.0 | -1.0 |
| EUR | 116.45 | 116.59 | 0.14 |
| CRUDE (1st cont) | 67.88 | 65.81 | -2.07 |
| SPX | 2721.33 | 2734.62 | 13.29 |
| VIX | 13.22 | 13.46 | 0.24 |
https://www.federalreserve.gov/newsevents/speech/brainard20180531a.htm
June 1. NFP
–Employment data today, with NFP expected 190k, Rate 3.9% and Avg Hourly Earnings +0.2 and +2.6 yoy (have heard some estimates at +2.8).
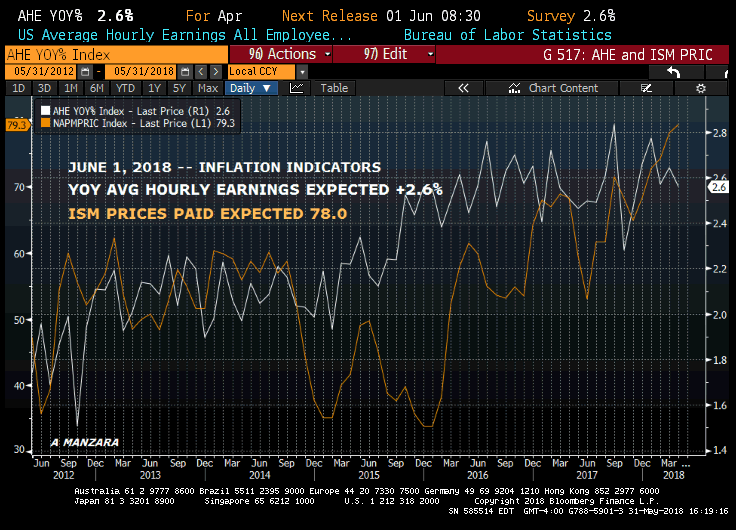
–While 5/30 is holding 32.2, 2/10 made a slight new low for the move at 41.4. Red/green pack spread closed at a new recent low of just 7.5 bps. Odds of Fed hikes have been slashed this week and yet the curve remains anchored near new lows, not exactly a vote for robust growth. On the other hand the Russell is near all time highs. A less aggressive Fed and gov’t protection? Should be inflationary…. (as charts below indicate)
–LIB/OIS ticks up yesterday on increase in libor setting to 2.3212. With only two weeks to go until June expiry, there is buying of both EDM8 9750 puts and 9787 calls for 0.25 (puts bought covered 9766.25). Obviously there are some concerns related to Europe. What if DB is put on a list of unstable banks and is downgraded? Oh…happened yesterday. What if Spain’s gov’t falls? Oh.
–EDZ8/FFF9 spread settled 39.5, right at the top of its range. EDU8/FFV8 closed 38.
–Going into today’s data with fairly meaty June midcurve straddle levels. 0EM 9725 straddle closed 11.5 bps with buying at that level just prior to close. 2EM 9712 straddle is 14.0. If today’s data comes out as expected, there should be some immediate compression, but it’s worth having (low) bids in for more unsettling news from europe over the next couple of weeks.