
Jan 7, 2018. Dynamic Markets
Markets can be much more dynamic than we appear to think. –Jerome Powell, from the October 2012 FOMC transcripts. (That’s gold Jerry! GOLD!)
The Fed just released transcripts from the meetings in 2012. I have included the link to the October 2012 meeting below. It’s 246 pages long; I’ve excerpted some salient points. What I would say is that Powell, at that time, was uneasy about the Fed encouraging risk taking. He was concerned that when it came time to reverse policy (as is occurring now) the market might not take the hand-off gracefully.
At that time, policy changes were expected when unemployment reached 6 ½ percent, and inflation 2 ½ percent. At one point it was Powell who, with considerable foresight, mentioned that those values might change over time.
Here are a couple of other Powell quotes:
First the question, why stop at $4 trillion [of QE]? The market in most cases will cheer us for doing more. It will never be enough for the market. Our models will always tell us that we are helping the economy, and I will probably always feel that those benefits are overestimated. And we will be able to tell ourselves that the market function is not impaired and that inflation expectations are under control.
Specifically addressing the unwinding of the Fed’s MBS position:
Another way to look at it, though, is that it’s not so much the sale, the duration; it’s also unloading our short volatility position. [The Fed does not hedge its MBS position; the private sector does]
And,
…I think we are actually at a point of encouraging risk-taking, and that should give us pause. Investors really do understand now that we will be there to prevent serious losses.
So here’s a guy who is circumspect about the Fed coddling the market. He is thoughtful about how conditions might evolve. He’s wary of the models. I would also mention that he seems to be one of the few who noted his personal discussions with hedge fund contacts and other market participants, at one point citing a specific deal being done on loose terms, but then providing a broader context of aggregate deal-making risk. In short, he’s pragmatic with a healthy respect for the market.
From the snippets above, we might surmise (though it’s a fairly long leap) that Powell would like to inject some risk discipline into the market; i.e. tighten financial conditions while putting the market on notice that the Fed’s backstop has moved, well, further back.
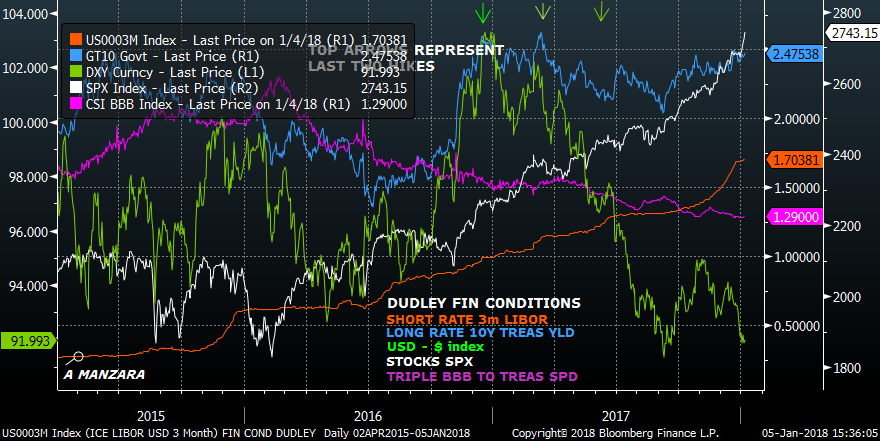
Dudley’s criteria for financial conditions are: short and long term rates, the value of the dollar, equities, and corporate spreads. From the chart below, we can see that since the middle of 2016, 3 month libor has risen 100 bps, from 70 to 170. But the ten year yield has never surpassed the high associated with the Dec 2016 hike. The dollar index has plunged, stocks have soared and corporate spreads have declined throughout 2017. Various regional Fed Financial Stress Index measures (St Louis, KC) look exactly like a long term chart of implied volatility on the ten year note, that is to say, near all-time lows. (I suppose that the KC stress level went up after Saturday’s wild-card loss). Can the Fed really tighten financial conditions? Should that be a goal?
On Friday, comments from a speech by Philly Fed President Harker (non-voter in 2018) scrolled through the news feeds. (link at bottom). He expects growth of a little under 2.5%; thinks there’s little slack left in the labor market, and is somewhat concerned that inflation will run below target. Therefore, he favors just two rate increases in 2016.
Harker appears to be a poster child for Powell’s concerns that the models will “tell us that we’re helping the economy… and that market functions are not impaired… and inflation expectations are under control.” So IF Powell wants to shift to an economy that prices risk more appropriately, (perhaps by indicating that the Fed “put” is being rolled down a few strikes), then he will have to clearly and credibly communicate that intention and drown out other opinions. (The Fed’s website does not list any major upcoming speeches in January, though Bostic and Dudley speak this week).
A quick footnote on a couple of the financial conditions noted above
The run up in stocks since September has been breath-taking, with SPX up about 12% over that time frame. A good deal of the move is attributed to the cut in the corporate tax rate, and of course foreign repatriation also figures into the equation. There are a myriad of factors that influence flows into the stock market, but if the value of a given stock is the present value of future cash flows, then I thought it might be useful to run through a very simplistic exercise. I took a stream of annual $10 payments over 30 years and discounted by 2% to arrive at a PV of $224. Given the tax deal, let’s assume these annual flows now go up to $11.50. Now the PV is $257, an increase of just under 15%. But now let’s change the discount rate to 3% and we’re right back to $225. The point, I suppose, is that Fed hikes should eventually bite into stock market exuberance. The market is forecasting an increased income stream discounted at low and sticky rates.
In the event of Fed tightening, one would also think the dollar would appreciate. But the dollar exhibited renewed weakness last week and is near the lowest level since the start of 2015. Some of this move is, of course, a reflection optimism regarding Eurozone growth and the related rally in the Euro.
The discussion now flows to the Eurodollar curve (and I’ll tie in a couple of large trades which occurred Friday). The near one-year calendar spreads closed at new highs. For example, the front 1-yr ED spread, March’18 to March’19, settled 47.5 (+3 on the week), essentially supporting Harker’s call for 2 hikes this year. The front 1-yr Fed Fund spread, Jan’18/Jan’19, settled at a new high of 57.25. Same story. However, the NEXT year forward, EDH19 to EDH20, only settled up +0.5 on the week to settle at 14. So the H/H/H fly settled 33.5 (47.5-14.0), and we have to go back to the 2004-06 hiking cycle to see these elevated levels in flies. As of Friday’s settles, the one-year calendars from 2019 to 2020 (reds to greens) averaged just 9 bps, and from 2020 to 2021 (greens to blues) just over 5 bps.
Stocks and the dollar are content to continue trending, in part taking their cues from the forward Eurodollar curve, which continues to flatten, signifying easy conditions ahead. So, Mr. Fed Chairman Powell, if you want to break the circle, start selling greens! (joking of course).
The big trade Friday relates to the above discussion. There was a seller of approximately 125k EDZ18/EDZ19/EDZ20 butterflies from 15.5 to 14.5. 100k was sold in one piece on a block, the largest trade I have seen for this type of structure. The fly settled 14.5; EDZ8/9 settled 20.0 and EDZ9/0 settled 5.5. According to prelim open interest figures, the trade is new. OI in EDZ8 +90k, EDZ9 +84k and EDZ0 +117k. Since September, this fly has rallied from -1.0 to Thursday’s settle of 16.5. When looking at a chart, it looks like an extreme. However, keeping in mind that the near one-yr fly settled 33.5, there is significant negative roll to overcome.
There was another interesting block of 20k: A sale of the 9 month double butterfly, EDH19/EDZ19/EDU20/EDM21. This breaks down as a sale of EDH19/M21 at 13.5 vs buying 3x as many EDZ19/EDU20 for 2.0. The standout in both of these trades is, 1) they are both buying EDZ19 and 2) the back spreads are very flat. In the regular fly the deferred spread, EDZ19/Z20, traded just 5.5 and in the double, a nine month spread, EDZ19/EDU20. traded for just 2.0 (settled 3.0).
Monday includes comments from several Fed officials. Rosengren and Williams on a panel discussing the 2% inflation target, and a speech from Bostic (voter in 2018). Dudley speaks on the economic outlook on Thursday. Auctions of 3’s, 10’s and 30’s Tuesday – Thursday. PPI Thursday, CPI and Retail Sales on Friday.
Here’s to the possibility of dynamic markets in 2018!
________________________________________________________________
| 12/29/2017 | 1/5/2018 | chg | |
| UST 2Y | 188.7 | 195.8 | 7.1 |
| UST 5Y | 221.0 | 228.4 | 7.4 |
| UST 10Y | 240.9 | 247.4 | 6.5 |
| UST 30Y | 274.1 | 281.0 | 6.9 |
| GERM 2Y | -62.7 | -60.5 | 2.2 |
| GERM 10Y | 42.7 | 43.9 | 1.2 |
| JPN 30Y | 80.8 | 81.5 | 0.7 |
| EURO$ H8/H9 | 44.5 | 47.5 | 3.0 |
| EURO$ H9/H0 | 13.5 | 14.0 | 0.5 |
| EUR | 120.03 | 120.32 | 0.29 |
| CRUDE (1st cont) | 60.42 | 61.44 | 1.02 |
| SPX | 2673.61 | 2743.15 | 69.54 |
| VIX | 11.04 | 9.22 | -1.82 |
https://www.federalreserve.gov/monetarypolicy/files/FOMC20121024meeting.pdf
https://philadelphiafed.org/publications/speeches/harker/2018/01-05-18-american-economic-association
Jan 5, 2018. PAYROLLS…. don’t matter
ADP higher than expected at 250k; today’s NFP expected 190k. Unemployment rate expected 4.1% with Avg Hourly Earnings +2.5% yoy. Short end yields continue to press higher, with the market pricing the idea of quarterly Fed hikes more aggressively over the near term. Two and five year treasury yields at new highs for the move, at 1.95% and 2.267% respectively. In dollars, near calendar spreads made new highs, and deferred spreads at new lows. For example, Jan’18/Jan’19 Fed Fund spread settled 56.25 and EDH18/EDH19 at 46.0. However, EDZ19/EDZ20, which is the cheapest one-year spread, settled at a new low of 4.0. Market trades as if Fed moves will crush inflation expectations and crimp future growth prospects.
–But stocks don’t see it that way. David Tepper comment yesterday captures the thought, (paraphrasing) “the market almost looks cheap with strong economic growth and low rates.” And by low rates, I think the broader picture is ‘easy financial conditions’, i.e., low and anchored rates at the long end and tight corporate spreads.
–The longer end of the treasury curve is at new lows. 2/10 marked just underneath 50 bps. 5/10 at 18.2. 5/30 sits just above 50 bps. Inflation premium is non existent, despite a good run in a lot of commodities…for example BCOM up 6% in a month, since December’s dip.
–New low for employment straddle in TY. The week-1 Jan 123.75 straddle (expiring today) trade just 17/64’s and settled there ref 123-21+. Breakeven of 124-005 and 123-155. Long rates are stuck in cement.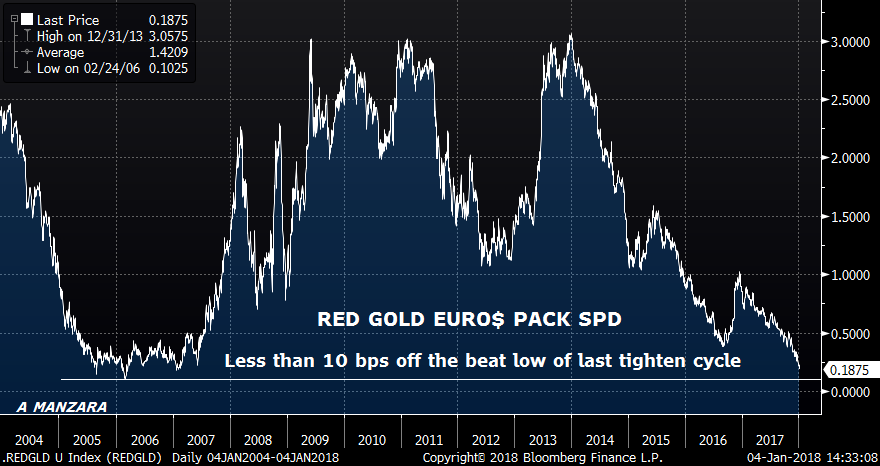
Jan 4, 2018. FOMC minutes confirm hiking bias
–Curve flatter as the Fed minutes supported the hiking campaign. Red/gold eurodollar pack spread closed at a new low just under 21 bps (-1.625 on the day). 2/10 notched a new low of 51.2.
–Jan’18/Jan’19 FF spread closed at a new high of 54.5. Heavy new selling in April’18 FF after the minutes pushed the contract to close -1.5 at 9840.5, which is 18.5 below the Jan’18 contract, indicating 3 in 4 chance of a hike in March. Good selling in front end of curve after minutes, for example EDZ8 was trading 9784, but fell to 9781.
–This morning, stocks are building on yesterday’s gains, USD is lower, rates higher, oil slightly higher. Boom times.
–A few trades of note include an early buyer yesterday morning of 80k TYG 125c for 6 to 7. Open interest up by 40k. Settled 5 ref 123-25 with 13 delta. Put and put spread buying is still a theme, for example, +30k EDU8 9787/9762ps for 6.5 (settled 7.0 ref 9792.0). This trade would likely fill out if there were hikes at the next three quarterly meetings.
–ADP (expected +188k) and Jobless Claims today, the Employment report is tomorrow with NFP 190k.
Jan 3, 2018. Ten year tip breakeven above 200 bps
–Rates edged higher Friday, with some pointing to a Goldman piece repeating that the Fed will deliver more hikes than being discounted by the market. The 2y yield rose 3.2 to 191.9 and 30y bonds were +6.9 bps to 281.0. EDH8 was sold heavily with several clips of 50k dumped at 9822.5 and 22.0. Settled 9821.0, with open interest dropping 26k, so it appears to have been long liquidation.
–The curve had a steeper bias. FFF8/FFF9 spread settled 53.5, a slight new high, while the peak one-year ED spread, EDH8/EDH9 closed at 44.5.
–In euro$’s there was a decent amount of call buying. Recently there has been heavy buying of 15-20 delta calls in June midcurves, today there was a much more aggressive buy of 20k 2EU 9787c covered 9759 with 28d and 3EU 9762c covered 9852 with 42d; 27 paid on the strip. These were new buys.
–Tomorrow includes Mfg ISM (I mistakenly thought it was yesterday) and the Fed minutes.
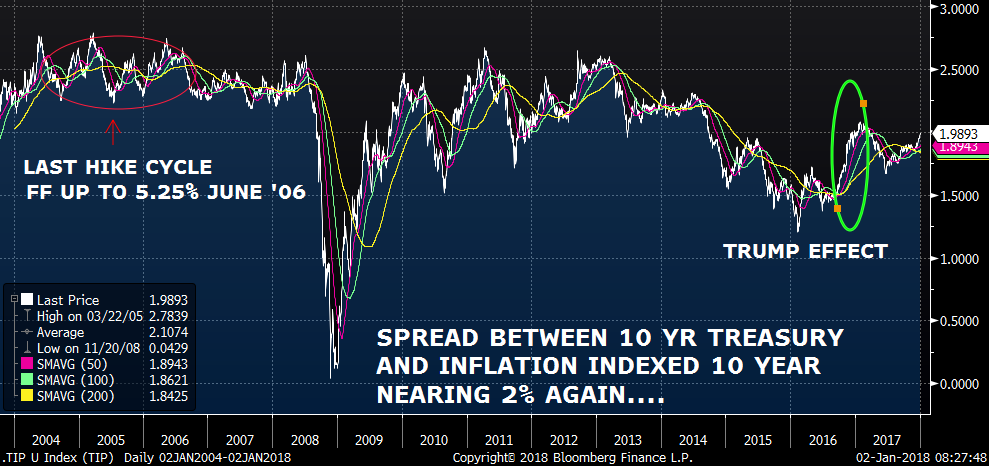
–I marked ten year treasury tip spread just above 200 bps (for the first time since last spring). Chart below. For all the hand-wringing about inflation targets, it’s interesting to note that during the last hike cycle this spread averaged about 250 bps even as the Fed hiked to 5.25%. Now at 200 bps and FF are 1.25-1.50%. It’s not about inflation; it’s about making sure companies have the cash flow to service larger outstanding debt. As an aside, WSJ reports that Venezuela missed another debt payment.
Jan 2, 2018. USD weaker to start the year.
–The dollar closed out 2017 on a weak note, and the theme is carrying through on the first trading day of 2018. The euro is trading 120.68, nearing the high of last year set in September, of 120.93. Over the weekend the ECB’s Coeure said “Given what we see in the economy, I believe that there is a reasonable chance that the extension of our asset purchase program decided in October can be the last.” (Reuters).
–Rates eased slightly Friday, with the ten year closing at 2.41%, down just over 2 bps. Interestingly, the ten year treasury to inflation-indexed tip note closed at a new recent high of 198.5. High of the year in Q1 was just under 210. There’s very little inflation premium built into the back end of the curve, but some indicators of future inflation are showing signs of life. Most measures of the curve closed at or near new lows. For example, the red/gold euro$ pack spread ended the year just over 21 bps, which is only about 10 bps above the low set during the 2004-2006 hiking cycle.
–In quiet trade Friday, June midcurve call buying continued. 0EM 9812c added 14k in open interest (t=263k), settling at 3.0 vs 9774.0 in EDM9. 3EM 9800c jumped 41k on new buys, settling 4.75 vs 9759.5 in EDM21.
–Mfg ISM today expected 58.2 with Prices 64.5.
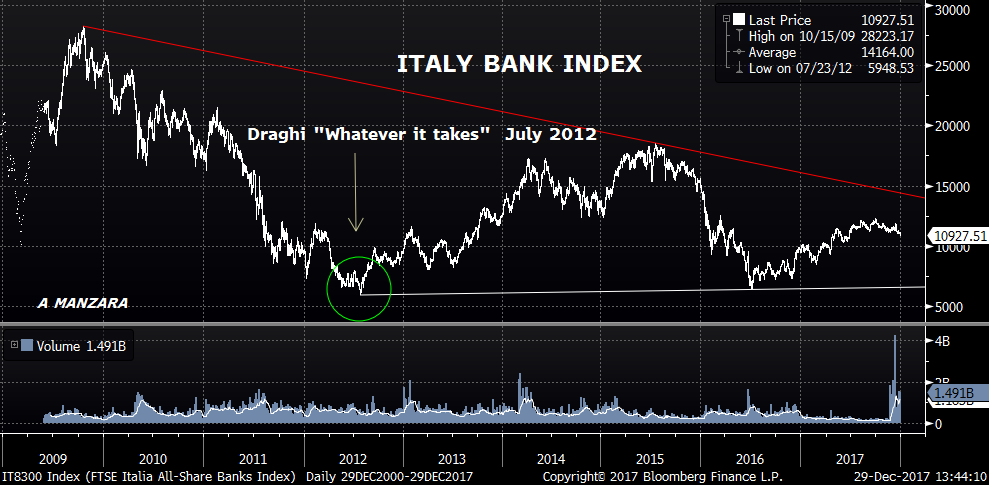
–Chart below is the Italy bank Index, appears to have rolled over at the end of the year. Something to watch; the primary concern of central banks is the health of the banking sector. Italy election is 4-March and the ECB is shaving its bond buying by €30 billion per month.
Dec 31, 2017. Beans and Bonds
It was early summer 1988. I was working in the financial room at the Chicago Board of Trade, the old original trading floor that occupied the fourth floor of 141 W Jackson. The business canyon of LaSalle Street ends where it tees into Jackson Blvd, defined by the imposing façade of the art–deco CBOT. On the west side of LaSalle is the Chicago Fed, and directly opposite is the old Continental Bank Building, mirroring each other with huge columns supporting their pediments, the former Corinthian, the latter Ionic; a trinity of buildings and functions which defined Chicago’s financial district. The old trading floor was directly below the bas-relief carvings of the Mesopotamian trader holding sheaves of wheat and Native American holding stalks of corn on either side of the center clock.

(CBOT clock. It’s 9:46. Grains have been open for 16 minutes, and they will close in 3 ½ hrs. Civilized)
In 1980, an annex was tacked onto the back of the old building, and this housed the new state-of-the-art grain trading floor, for corn, wheat, oats, and the soybean complex, including oil and meal. The two buildings transitioned on the fourth floor in a corridor; when you got off the escalator or elevator, you would walk toward the west wall and either turn north to the drab financial room, or south to the sparkling new entrance of the grain room.
Anyway, it’s 1988, and I walk off the floor to grab a cup of coffee at about 9 am. And I’ll never forget all these old guys streaming onto the grain floor for the 9:30 opening bell. It just hit me all at once. The financial floor community was mostly in their 20’s and 30’s. These guys were older, some were actually hobbling onto the floor using canes, with grey hair and big yellow full membership badges on their trading jackets. When I got back to the desk, I said something like, “Holy cow, I’ve never seen so many people coming on to the grain floor!” Someone replied, “There’s a drought. They’re all coming back for a last hurrah to print money in the wild markets.”
Back in those days, I think a lot of the people at the Chicago Board of Trade thought that they were at the pinnacle of finance. It was either beans or bonds. There were actually guys that looked at that spread, as if they were the only two things worth trading in the universe. Beans in the teens was a rallying cry. In 1988, the front bean contract went from $6 to a peak of $11/bushel within a few months. Bull market!
How different things are now.
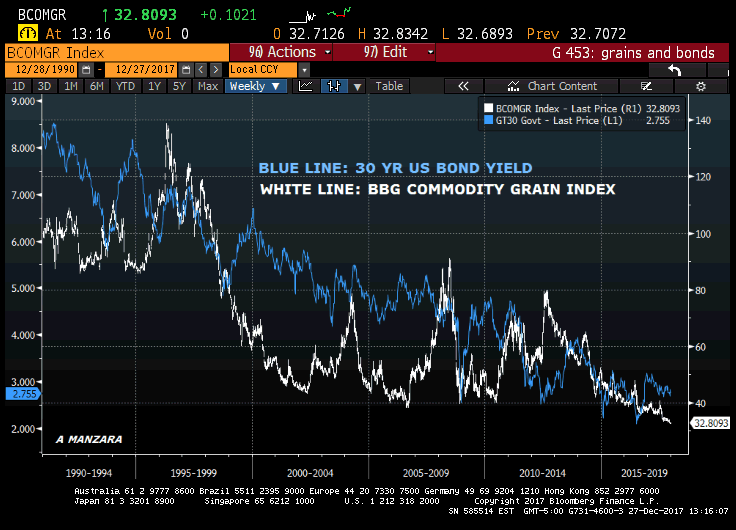
Both bonds and beans (grains) have dwindled. The Bloomberg Commodity (BCOM) Grain index is as low as it has been since 1990. The chart above is a bit disingenuous. Between 1990 and 1994 Corn was $2-$3/bushel, now it’s 3.50. Wheat was between $3 to 4, now $4.25. Beans were $5.50 now $9.50. So prices aren’t at new lows, but Bloomberg’s description of the index says it “reflects the return of underlying commodity futures price movements…”
Fast forwarding, and just looking at the 30-yr bond yield, in December 2008 during the heat of the crisis, the yield plunged to nearly 2.5%. In early 2015 as oil tanked, it traded just below 2.25%. The low was post-Brexit in the summer of 2016, at 2.10%. This year, in 2017, there have been 3 important lows in the last half of the year: 2.70 in June, 2.66 in Sept and 2.69 this month. A close below 2.60 would be a problem for shorts (Friday closed 2.74%). On the other hand, a close above this year’s high of 3.21 would indicate a long term bottom. Just circling back to the early years, the NOTIONAL coupon on the bond contract was 8%. And in the 1980’s, futures traded well below par. It wasn’t until 1999 that the CBOT announced it would change the underlying contract specs from an 8% to a 6% coupon. The last time the 30 year bond yield was above 8% was in late 1994.
In terms of the grains, there are many factors which hold down prices, most of which are way beyond my scope. Yields are much higher given advances in agricultural technology. There’s more global production. And of course, the government is involved with ethanol subsidies and crop insurance, both of which tend to accentuate production. On the other hand, the population of the globe continues to increase. Are prices correctly balancing these factors? That, I suppose, is the assumption we work with.
In the year 2017, both the ten year yield and the Bloomberg Commodity Index are essentially closing out at the same place they started. On 30-Dec 2016 the ten year yield was 244.5, and the BCOM was 87.50. On Dec 29, 2017, the ten year is 241.0 and BCOM 88.16.
I don’t think it’s going to remain this way in 2018. Inflation has been tame, wage growth tepid. However, the tax program should both spur growth and create a hole in the Federal budget. In spite of Fed hikes in 2017, the dollar is finishing the year near its low and looks set to weaken further. QT is advancing in the US, and this weekend Coeure of the ECB said, “Given what we see in the economy, I believe that there is a reasonable chance that the extension of our asset purchase program decided in October can be the last.” (Reuters).
I’m sort of using the ‘beans and bonds’ analogy the way economists use ‘guns and butter’. I am generally referring to ‘beans’ as commodities, and ‘bonds’ as US rates. That is, I think 2018 will be a year of accelerating inflation, and a year when commodities will rise up from being a doormat asset class. Note that copper and oil closed out the year on the highs. Bond yields should also rise for a variety of reasons, and may do so quickly.
Buy beans. Sell bonds.
In: Eurodollar Options
Dec 26. The forward curve projects ….. BORING
–Yields declined on what appeared to be a low volume short covering rally. Tens fell 5.3bps to 241.2. The curve flattened to new lows. With this week’s auctions of 2’s and 5’s, 2/10 is now just 51.7 and 5/30 at 52.8. The 5/10 treasury spread is below 20 bps (I marked at 19.2). It’s the same story with eurodollars. Red/gold pack spread collapsed by 2.75 bps to just 21. The red/green pack spread is 8.375. All new lows. As mentioned yesterday, the low in red/gold in 2006 after 13 straight hikes (there would ultimately be 17) was just over 10 bps. So we’re currently 11 bps away.
–When looking at 3 month euro$ deferred calendars, it’s remarkable to see several of them at 1 bp and one (EDZ19/EDH20) at just 0.5. It might be understandable if rates in general were much higher, but EDZ19 is 9766.5 and EDH20 is 9766.0, a forward ‘forecast’ of 3 month libor at just 2.34% in TWO years! There’s not much of an inflation premium built in. Just blind acceptance of low R* which the Fed unwittingly reinforces.
–The dollar index is within spitting distance of the low of 2017. Economically sensitive commodities like copper and oil are going out at the year’s high. Yet the forward euro$ curve can only see low growth and low inflation. It’s often said that the interest rate markets are much ‘smarter’ than equities. But it all looks stupid from here.
–Job Claims expected 240k. Chicago Purchasing Mgr expected 62.0.
Dec 22. High yield ETFs are flat for the year…
–Quiet day in fixed income though the curve edged flatter and premium was bid. On a day where futures prices were close to unchanged, deferred midcurve straddles gained 1-1.5 bps. Perhaps after the recent thrashing no one wants to be overly short vol going into the holiday weekend.
–New highs in near euro$ calendars. For example, the peak one-year spread is EDH8/EDH9 which closed +1.0 at 43 bps. In Fed Funds, Jan18/Jan19 settled 51.5, so over 2 hikes for next year…
–Bitcoin: we heard a trade of $1mio premium paid for $50000 call strike price, Dec 2018 expiry for 275 bitcoin.
I divided $1mio by 275 and get just over $3600 per call. I used an underlying price of 16000, and an expiry date of 12/17/2018 and get implied vol around 135%. If using an underlying of 17000, then implied is 129%. I am not certain if that’s correct, but I will say that VIX is around 9.6 and VXN 12.6, so we’re talking at least 10x higher, which I suppose makes sense in the context of a market that has just fallen 30% from its peak and is still up over 10x on the year.
–Another thing to mention is that high yield etf’s gapped lower yesterday. Both HYG and JNK are essentially where they started the year. This is something to watch; widening spreads mean higher vol. What the federal gov’t gives in the form of tax relief, the credit markets can remove in the form of more stringent lending standards. It’s the debt, stupid.
–News today includes Personal Income and Spending expected +0.4 and +0.5. Core PCE prices expected +0.1 and yoy expected 1.5 from 1.4. This is the Fed’s preferred measure of inflation. A high this year of 1.9 in January, and a low of 1.3 in August. Also released is Durables expected 2.0, New Home Sales 655k.
–Happy holiday weekend! Alex Manzara
Dec 20. 2 and 5 yr yields at new highs
–2year and 5y yields made new highs at 185.2 and 221.8 respectively. The ten year equaled the high of late October at 246.3. Curve steepened as 2/10 leapt nearly 5 bps to 61.1. Ten year note to TIP (inflation indexed note) made a new high of 193 bps, nearing 2%, though that particular spread doesn’t seem to have much predictive power.
–The big position in USG 153p was shaved back; open interest fell 10k to 46k (sold 152/153ps). Those puts settled 2’21 ref 151-16.
–Big trade yesterday was a buyer of EDH8 9787.5p for 0.25. Total 227k trade with open interest up half that amount. In dollars there continues to be new selling in EDU8 (rolling from EDM8 shorts). EDM8/EDU8 settled at a new high of 10.5. Back month spreads also showed glimmers of life. EDZ8/EDZ9 gained 1.5 to close 18.5. Red/gold pack spread +3.0 to 29.625.
–Stocks are bouncing on the tax bill. Bitcoin, not so much. $/yen been capped just a bit over 114 since May. Yen weaker this morning. 3m Yen Vol is about as cheap as it has been (as low as it’s been since 2014) but if upper end of recent range is broken in $/yen it should carry to 120.
Chart of 3m yen vol below

Dec 19. Nice put buys
–Big trade of the day in euro$’s was a buyer of EDM8/EDU8 for 9.5 to 10 in size of over 100k. Spread settled 9.0 on Friday and 10.0 yesterday. This trade is likely just a roll associated with the expiration of the EDZ7 contract. (which had a final settlement of 98.3745). Open interest -79k in EDM and +66k in EDU.
–EDH8 settled 9822.5, so the spread of EDH8 to libor is 15 to 15.5 bps. A similar spread to consider with respect to hike odds for the March FOMC meeting is FFG8/FFJ8 which settled at 17 bps. Hike odds about 2 out of 3 for March.
–The curve steepened Monday. One notable aspect of the move was the USH contract, which closed down 1-03 at 153-06. 30-yr cash bond rose 5.8 bps to 274.2. Last week there had been a buyer of around 50k USG 153p mostly at premium of 1’03 to 1’05. Friday’s settle was 0’61 vs 154-09; Monday’s was 1’23 vs 153-06. Tidy gain of 0’26/64s.
–I haven’t seen much mention of this, but as the year winds down it’s worth noting that the Fed’s QT program will kick up another notch in January, to $12b/month in treasuries and $8b/month MBS. The schedule was first announced in June and implemented in October (as per Sept FOMC). Not much effect so far, but keeping an eye on corporate spreads. By the way, end of year pension fund buying also running down.
–Speaking of which, there’s another BBG story on HNA (large China conglomerate) that’s having liquidity issues. One of HNA’s airline units scrapped plans for a 270-day debt offering (Tianjin Air). HNA owns 10% of Deutsche Bank; as of now no signs of stress reflected in DB. Maybe the ECB should buy some HNA bonds to replace the gap left by Steinhoff. :-l
