
Benign CPI expected
February 13, 2024
********************
–CPI today, expected 0.2 vs 0.3 last, month/month. YOY expected 2.9 to 3.0 from 3.4% last. YOY Core expected 3.7% from 3.9% last. Yields were down marginally on Monday, with 2s, 5s and 10’s down around 2 bps, 10y yield -1.7 at 4.168%. SOFR curve a bit flatter with H4 -1.0 at 9476.5, H5 +1.5 at 9611.0 and H6 +4.0 at 9651.5. Volume was light. Risk is that CPI comes out hotter than expected. Powell has focused on Core Service prices, as have others, which likely require weaker employment data than we’ve been seeing. CLH4 up another 0.69 this morning at 77.61. Big tech stocks losing altitude.
–NFIB Small Biz Optimism out before CPI, expected 92.3 from 91.9. Been in a tight range near the lows for a year and a half, between 92.1 and 89.0. Inflation and labor quality are top issues.
–Constant maturity red/green sofr pack spread edged to slight new recent low -14 bps, but in general has been moving up since a low of -57 in September. Hi on Jan 16 was +1.625.
–Large trade of the day was buying of 0QU4 / 0QZ4 9650 straddle spread for 14.5 to 15, in 20k. These are midcurves on SFRU5 and SFRZ5 which expire this year, on 13-Sept and 13-Dec. Underlying prices settled 9645 and 9651. Straddles at 82.0 and 97.0, sold Sept and bought Dec. The first thing I’d note is that the 0QG4 (midcurve Feb) atm 9612.5 straddle settled at 15.5 ref 9611, with just 4 days until expiry. So when Sept expires, then one might expect Dec to have a lot more time value than 15 bps. However, I am thinking this might be more of a pre-election/post-election play. In any case, the position added about 15k open interest to all strikes. The idea also traded as 0QU4/0QZ4 9600/9700 strangle spread for 14.5. Strangles settled 42.25 and 56.75. Open interest up about 4k in those strikes.
Eases are still there, just further back
February 12, 2024
*******************
–New recent highs in near SOFR calendar spreads on Friday as back contracts continue to re-price both the timing and magnitude of easing. On Friday, red sofr contracts closed -5.125 at avg price of 9632. SFRH4/SFRH5 calendar settled -132, up 5 on the day (9477.5/9609.5). On Feb 1, the day after the FOMC, the spread settled -160.5. There’s been a lot of talk about the FOMC having 3 cuts priced into the end of this year, and the market having had six or more cuts priced. The March’24/March’25 spread represents a slightly forward one-year period and still indicates 5 to 6 cuts, even though it has rallied somewhat. (Also, while many think of the spread as forecasting the number of eases, it really represents odds of various scenarios related to the timing and magnitude of rate cuts).
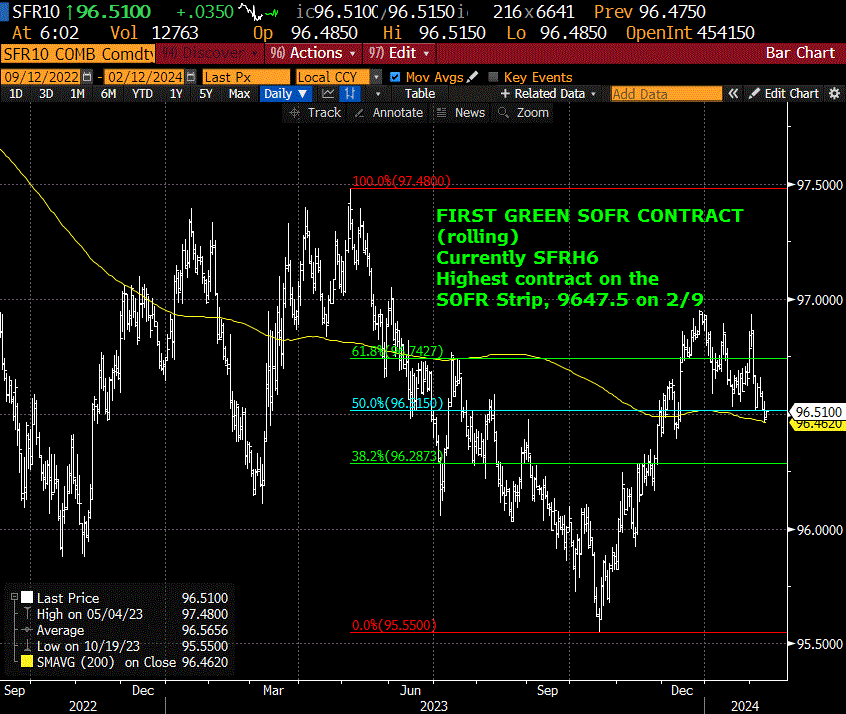
–I have attached a chart of the rolling first green SOFR contract. As you can see, recent highs in the beginning of 2023 and again just after the SVB blow-up were around 9740 (high print 9748) and the low in Oct was 9555. The first green (and last red, currently SFRZ5) are the peak contracts on the strip, settling Friday at 9647.5. right around the middle of last year’s range.
–CPI out tomorrow, expected 3.0 to 2.9% yoy from 3.4% last.
Let them eat chocolate
Feb 11, 2024 – Weekly Comment
***********************************
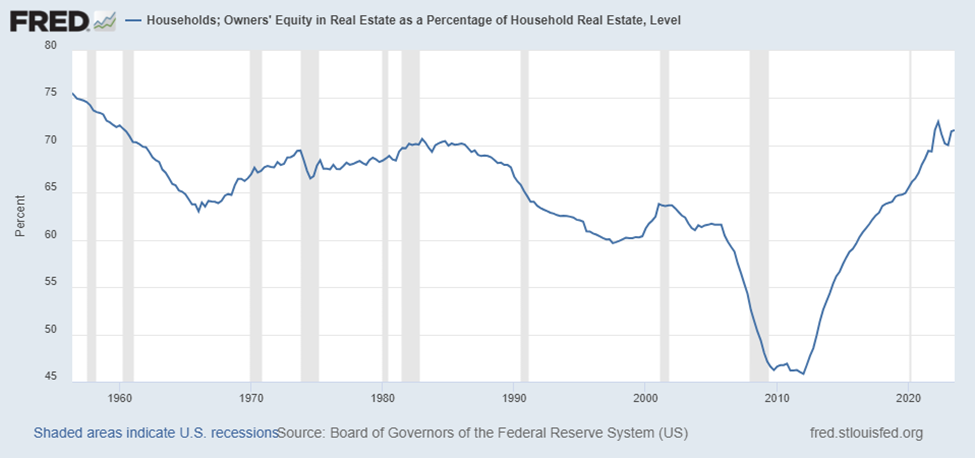
The image below is from the St Louis Fed; Households Owners’ Equity in Real Estate as a Percentage of Household Real Estate, Level. It’s nearly 72%. And surpasses every level since 1960! After the GFC, Homeowner’s Equity fell to around 46%.
The next image is the homeownership rate (starting a bit later, in 1965).
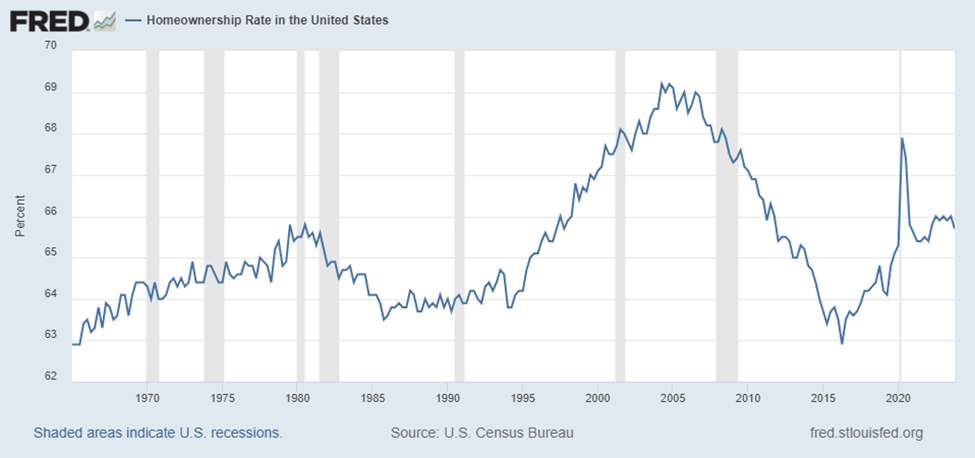
The homeownership increase from the mid-1990’s peaked right in the middle of 2004, when the Fed began its hiking campaign from 1% to 5.25%. The huge rate cuts in 2001 gave way to the adjustable-rate mortgage spree going into the GFC. The FF target was 1.25% to 1% from late 2002 to mid-2004, and shorter-term adjustable rate mortgages were in vogue.
Currently, there’s hand-wringing about Consumer Credit being at a record high $1.3t, and HH mortgage outstanding also at a record high $12.950t. However, 15 years ago in 2009, HH Mortgage was $10.441t and HH Owner-Occupied Real Estate was valued at $19.417t. Since then, the amount of mortgage outstanding went up 24% but the value of HH RE more than doubled to $45.5t. Nothing to see here.
In 2008 Revolving Consumer Credit peaked at a little over $1t. At the time nominal GDP was $14.97t and now it’s nearly doubled to $27.9t. Again, an increase of 30% in debt vs a double in income. In aggregate the household sector seems rather conservative since the GFC, though perhaps less so in very recent history.
Where HH debt has exploded at a growth rate well exceeding the growth of the economy is Non-Revolving Credit, from $1.64t in 2008 to $3.7t now. The culprit is student loans which went from $135 billion at the end of 2008 to $1.467t now. If student debt is removed from the equation, then both revolving and non-revolving credit have grown more slowly than the economy.
Households that own unmortgaged property and have savings are doing just fine. They had bank deposits that were earning nothing, then the Silicon Valley Bank Crisis focused everyone on the risks of bank bail-ins, while at the same time t-bill and money markets were paying 5% or more. Income from bills and bonds now actually provides a cushion for equity investing. This part of the population is quite different from the portion suffering rising credit card and auto loan delinquencies and complaining about the spiraling costs at fast food restaurants. In last week’s congressional testimony, Yellen said, “We don’t have to bring prices down, because wages are going up.” She might as well have said, “Let them eat chocolate!” (The price of cocoa has doubled in the past year and is up 35% just since the start of 2024).
Back to the charts above. The percentage changes aren’t huge; does it really matter if homeownership goes down from 68% to 66%? Maybe not. However, my interpretation of the data highlights growing wealth disparity. Not exactly a novel topic. However, everything happens at the margin. Fraying begins at the edges.
My personal opinion is that government has accentuated a lot of problems. Whether that’s right or wrong, there is no question about the growth in government. In 2009, Federal Debt outstanding was $8.88t. As of Q3 2023 it’s $28.75t, 3.25 times higher. Compare that with the relatively muted increases in consumer borrowing (ignoring federally funded student loans).
I knew a corporate bond salesman from 20 years ago, who amusingly handed out business cards which listed his title as ‘Treasury Bond Credit Analyst’. Funny. There is no credit aspect of treasuries to analyze. Right? But anyone who looks at the growth of Federal Debt vs Income sees the deterioration.
I saw this item in worthinsurance.com. “Among homeowners, an average of 16.4% of their income goes to housing costs. This includes mortgage, property taxes and homeowner’s insurance. Meanwhile, 45% of renters spend over 30% of their household income on housing costs.”
The big asset managers have loaded up on residential real estate to take advantage of rising rents. Given the current AirBnB bust, perhaps the rental strategy has some holes in it. Is there another government bailout around the corner?
OTHER THOUGHTS
The ten year yield rose 16.7 bps this week to 4.185%. On the SOFR curve, the biggest declines were Sept’25, Dec’25, March’26, June’26, all down 19 bps (9642, 9647.5, 9647.5, 9645.5). The middle two of those contracts are the peak, or lowest rates, on the SOFR strip, at about 3.5%. It’s not surprising to see yields moving higher in this part of the curve, given relatively strong economic data, large treasury auctions, and Fed officials pushing back against the magnitude of rate cuts that had been priced in STIR futures. However, the curve really didn’t flatten much. Gold SOFR contracts, the fifth year forward, were down 15.75 bps on the week. Consider this longer term chart of the 2/10 treasury spread:
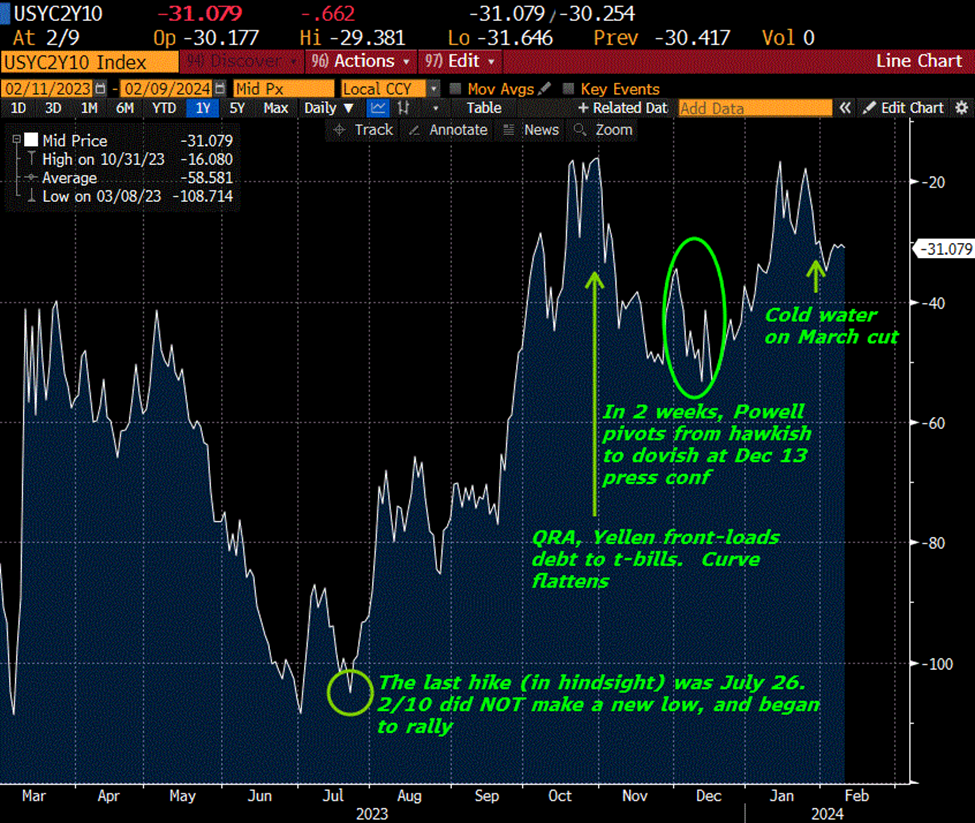
There’s a double bottom from March and July 2023, at about -108. Recently the chart has a double top around -16. The curve has flattened since the last FOMC, but the move has been muted. Closes above negative 16 would suggest Fed rate cuts of more than 75 bps by year end. I favor a steepening curve, easily expressed using SOFR contracts and or options. I will post specific rec by e-mail on Monday.
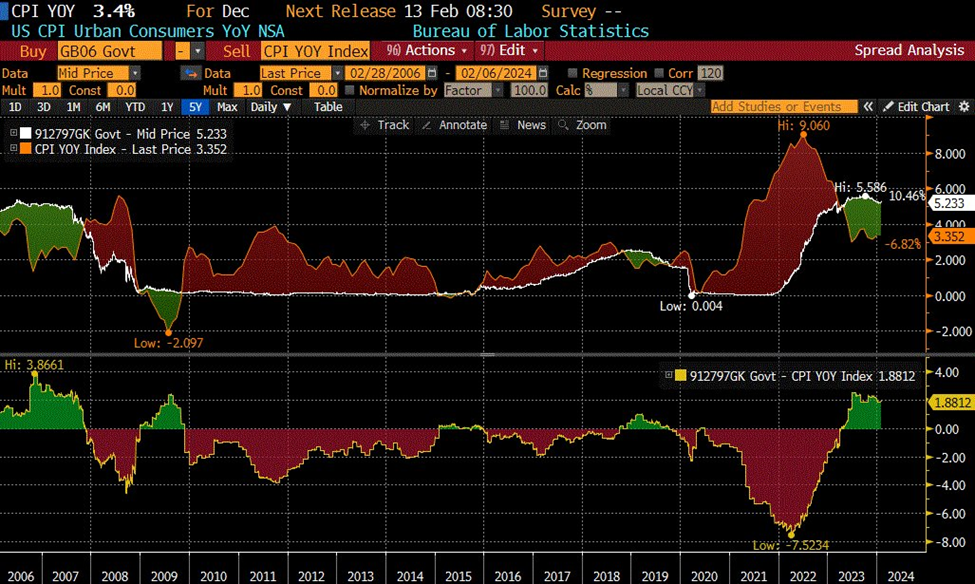
CPI is out on Tuesday, expected 2.9% yoy vs 3.4% last. If expectations are correct, it would be the first sub-3% print since Q1 2021. Core CPI yoy expected 3.7% from 3.9% last. Retail Sales on Thursday. The chart below shows CPI vs the 6-month t-bill yield. The cross to a positive ‘real yield’ only occurred about eight months ago. This spread has only been above 200 bps (currently 190) a few times since 2000: In 2000, corresponding to the dotcom bubble burst, in 2006/07, about a year before the housing bubble burst, very briefly in 2009 and now. 2001 and 2008 landings weren’t all that smooth.
| 2/2/2024 | 2/9/2024 | chg | ||
| UST 2Y | 437.0 | 448.6 | 11.6 | |
| UST 5Y | 399.7 | 414.9 | 15.2 | |
| UST 10Y | 401.8 | 418.5 | 16.7 | |
| UST 30Y | 422.7 | 438.0 | 15.3 | |
| GERM 2Y | 256.9 | 271.6 | 14.7 | |
| GERM 10Y | 224.1 | 238.2 | 14.1 | |
| JPN 20Y | 145.0 | 150.9 | 5.9 | |
| CHINA 10Y | 242.9 | 243.9 | 1.0 | |
| SOFR H4/H5 | -146.0 | -132.0 | 14.0 | |
| SOFR H5/H6 | -40.5 | -38.0 | 2.5 | |
| SOFR H6/H7 | 7.5 | 6.5 | -1.0 | |
| EUR | 108.09 | 107.84 | -0.25 | |
| CRUDE (CLH4) | 72.28 | 76.84 | 4.56 | |
| SPX | 4958.61 | 5026.61 | 68.00 | 1.4% |
| VIX | 13.85 | 12.93 | -0.92 | |
https://www.federalreserve.gov/releases/z1/20231207/html/b101.htm
In: Eurodollar Options
Treasury having no problem placing debt
February 9, 2024
******************
–Quiet day in rates. Thirty year auction was solid, WI 4.38 at time of auction, but the actual result was 2 bps thru at 4.36%. Barkin added his voice to Fed speakers who, outside of Goolsbee, don’t seem to be in any hurry to cut rates. From the bullet points prefacing Barkin’s speech, “Given robust demand and a historically strong labor market, we have time to build that confidence before we begin the process of toggling rates down.” Lorie Logan, Dallas Fed President, speaks this afternoon and is likely on the same page; from her Jan 6 speech, “…the job of restoring price stability is not yet complete.”
–Today’s brings annual seasonal revisions to CPI. In case missed yesterday:
https://think.ing.com/articles/why-us-cpi-revisions-could-be-a-big-deal-or-mean-nothing-at-all
Monthly CPI release is Tuesday.
–Yellen’s comment yesterday that “We don’t need to get prices down because wages are going up” rings a bit hollow to the average household. If she had said “we don’t have to get prices down because the tech darlings are going up” it would be more truthful. Feels a lot like the dotcom run up. Uber is up 75% since end of October, 40 to 71.66. Dash is up a similar amount, 70 to 118.30. Certainly doesn’t feel as if financial conditions are tight. However, it depends on one’s location on the economic spectrum. McDonald’s CEO acknowledged that his consumer base is increasingly strapped and McD needs to focus on affordability.
–Crude oil has had a nice pop of $4/bbl this week. Last Friday’s settle in CLH4 was 7228 against yesterday’s 7622, +236 on the day.
Disinflation from China, NatGas, tightened lending standards. BUT…Feb 9 CPI revisions
February 8, 2024
*******************
–The backdrop continues to be weakness in regional banks, but KRE (regional bank ETF) came back from lows to close nearly unchanged. US yields rose slightly, but the ten year auction went surprisingly well; WI was 4.105 and actual was 4.093%. TYH4 settled 111-06, down just 3 on the day. SOFR contracts from March’25 to March’28 were down 2 to 3 bps. Probably the cleanest expression for rates a year from now is the FFG4/FFG5 calendar, which settled -135.75 (9467.75/9603.5). So Fed Funds for Feb of next year pricing right around 4% (First meeting in 2025 should be Jan 29).
–US news today includes Jobless Claims, expected 220k and the 30y auction. Every financial news site this morning has a clip about deflation in China. This is from NikkeiAsia:
Figures released by the National Bureau of Statistics on Thursday showed that prices for consumer goods slipped 0.8% [expected -0.5%] from the same month a year earlier, the biggest such drop since September 2009 and steeper than the 0.3% decline in December. It was the fourth straight month of falls in China’s consumer price index (CPI).
–In the US, yesterday the Nat Gas contract hit a new low sub- $2; it was around $5 at the end of 2022. Biden admin’s suspension of LNG exports is, of course, adding downward pressure. Also, Consumer Credit figures for December were in stark contrast to November’s surge. In Nov, Revolving Credit grew $17.9b. In Dec it grew $1.1b. At annualized rates, Revolving was up only 1.0% in Dec and Non-revolving +0.2%.
–Even though Powell poured cold water on a March rate cut, the market is still assigning small odds. For example, a buyer yesterday of 25k SFRH4 9481.25/9487.5cs for 1.25. April FF settled 9472.5 or 5.275% vs current Fed Effective 5.33%. CPI is released on Tuesday, though the Fed’s Waller mentioned in his last speech that he was circling the date of Feb 9, tomorrow, to study the impact of annual seasonal revisions made to CPI. From Waller’s Jan 16th speech:
One piece of data I will be watching closely is the scheduled revisions to CPI inflation due next month. Recall that a year ago, when it looked like inflation was coming down quickly, the annual update to the seasonal factors erased those gains. In mid-February, we will get the January CPI report and revisions for 2023, potentially changing the picture on inflation. My hope is that the revisions confirm the progress we have seen, but good policy is based on data and not hope.
Nat Gas below:

Good demand for 3’s; large ten-yr auction today
February 7, 2024
******************
–Yields pulled back from highs made post-NFP, with tens down 7 bps to 4.09%. However, futures are down slightly this morning in front of today’s FORTY-TWO billion 10y auction. TYH4 settled 111-09 and currently prints 111-03+. Auction coincides with news that the SEC is considering new regulatory “fixes” on the basis trade. Impact on liquidity?
–NYCB back in the news, having been downgraded to junk by Moody’s. KRE, the regional bank ETF was down 1.26% yesterday to 46.97. Post-SVB in May it had reached 35. That’s when the first SOFR 1-yr calendar hit -192 as the Fed held off on the idea of easing despite banking turmoil; fronts were held down while back contracts soared. Around that time the green sofr pack (3rd year forward) traded around 9725. Current SFRH4/H5 is -143 (9478.5/9621.5) and the green pack is 9659.
–Plenty of Fed comments today, including Kugler (new to the Fed board) at 11:00, then Collins, Barkin, Bowman. April FF settled up 1 at 9472.5, about 5 higher than Feb, which is pegging the current EFFR of 5.33%. The May FOMC is May 1, and FFK4 settled 9487.5. If the Fed eases by 25, then EFFR should go to 5.08% or a price of 9492. Recall that FFJ4 had previously settled above 9492 on Dec-27 (high settle 9494).
–Consumer Credit released at the end of the day. Last (November) was $23.75b, with a whopping annualized gain of 17.7% in revolving credit. Expected $16 billion for Dec.
Yields press higher into auctions
February 6, 2024
******************
–Yields continued to rise going into the start of auctions, with the three-year today. Tens jumped another 13 bps yesterday to 4.16% as ISM Service data and prices were stronger than expected. Today also features Fed comments by Mester, Kashkari and Collins. Goolsbee said yesterday that he doesn’t want to rule out a March cut, however, the market has pretty much removed that possibility. FFJ4 settled 9471.5 or 5.285% vs EFFR of 5.33.
–New high settle in SFRH4/H5 at -136.5 as reds were hit hard. SFRH4 fell 12.5 to 9613.5. Red pack -13.5. Everything from June’25 to golds (5th year) were down 13 to 14.
–SNAP yesterday said it would cut about 10% of its workforce (528 people). Not a big number, but layoff announcements appear to be at odds with Friday’s payroll data. Fed’s Sr Loan Officer Survey (SLOOS) was out yesterday. From the report, “…survey respondents reported tighter standards and weaker demand for C&I loans to firms of all sizes over Q4” Same with Commercial Real Estate. “Moreover, for credit card, auto and other consumer loans, standards reportedly tightened, and demand weakened on balance.”
Anecdotal evidence seems to suggest a weakening economy.
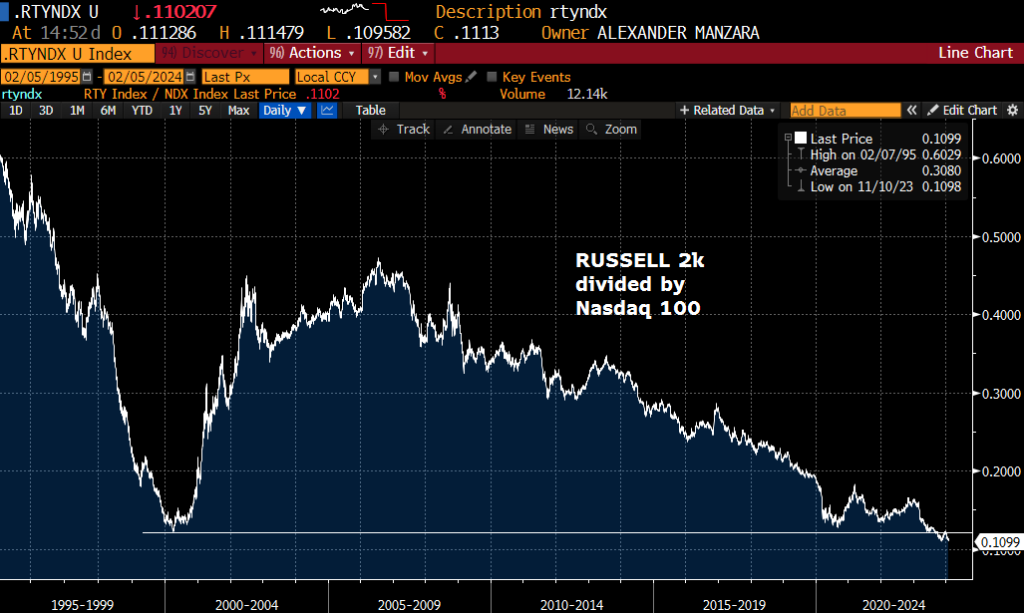
–Attached is chart that shows Russell 2k divided by Nasdaq 100. Even lower than the dotcom bubble in 2001. When Nasdaq started to deflate, the Fed was spurred into aggressive easing in 2001 (200 bps in 4 months). CPI at the time was right around where it is now, 3.4%.
Pushing the ease back
February 5, 2024
******************
—Friday’s blowout NFP at 317k caused an implosion in rate futures. Weakest SOFR contracts were Dec’4 and March’5, both settling -23.5 at 9595.5 and 9626.. SFRH6 settled -20 at 9666.5 and H7 -18.5 at 9659, so inversion was accentuated slightly from reds back. The five-year yield jumped nearly 20 bps to end 3.993%, while tens rose 17 to 4.031%. This week features auctions of 3s, 10s and 30s beginning tomorrow. Many have expressed skepticism about the strength of Friday’s data. The workweek was only 34.1 hours, near the depths of covid.
–April FF are the best indication of March 20 FOMC odds; settled 9473 or 5.27%, as compared against current EFFR of 5.33 or 9467. At Wednesday’s press conference, Powell suggested the Fed would not likely have the confidence to cut in March, which he repeated in the 60 Minutes interview aired yesterday. In today’s session, the low so far in FFJ4 is 9471.5 and the low in SFRH4 is 9474. Rate cut odds have been substantially squeezed out of March, and of course rates across the curve have shifted higher. TYH4 settled 111-21 on Thursday and this morning has posted a low of 111-04; the low in 2024 has been 110-26 on Jan 19. SFRZ4 this morning prints 9587.5, which is still about 125 bps above the SFRZ3 price in mid-Dec, but the market is coming a little bit closer to the “three cuts in 2024” implied by the dots.
–In the 60 minutes interview, Powell said, “We looked at the larger banks’ balance sheets, and it appears to be a manageable problem”, referring to CRE valuation issues. Powell openly admitted that the Fed whiffed on SVB. Many have noted that in the December FOMC statement, the second paragraph started with the sentence, “The US banking system is sound and resilient.” That line was absent in the Jan 31 statement. Lower rates and a positive curve would help nurse regional bank balance sheets back to health, but Powell clearly stated the Fed does not take political considerations into account during FOMC deliberations, so the lifeline of lower funding costs for regionals is a little farther away..
–News today includes ISM Services, expected 52.0 from 50.8 last. Bostic speaks at 2, and there are Fed speeches throughout the week. Today also includes the Fed’s Senior Loan Officer Survey at 2:00, which could be important with respect to credit conditions and CRE.
Payrolls and toilet paper
February 2, 2024
*******************
–All I can say is I’m glad I have the Peloton / Novo Nordisk (Ozempic) spread on. If it takes effort, bad. If it’s a simple pill, good. I guess the Shanghai Comp (new lows) vs META is another appropriate spread. META blew away expectations and is up 16% pre-open. China’s stimulus measures have flopped with new lows in SHCOMP.
–SOFR curve flattened hard; a contributing factor was stronger than expected Mfg ISM at 49.1, and Prices Paid at 52.9. SFRH4 settled 9489, -2.5, H5 9649.5, +3.5 and H6 9686.5, +8.0. The highest settle on the SOFR strip is Dec’25 at 9687 or 3.13%. Near one-year calendars printed new lows on the day. SFRH4/H5 printed -165 and settled -160.5 and SFRM4/M5 settled at a new low -132.5 (9538/9670.5). Continued worries about bank contagion saw KRE regional bank ETF close -3.1%. While odds for the March FOMC have clearly shifted toward HOLD, SFRH4 out-of-the-money calls are crazily bid. SFRH4 settled 9489, but calls 111 away, the 9600 strike, settled 1.25 (and were bid there), and 9700c were 0.25/0.75 and settled 0.5 with 42 dte. There are 7.6 million open interest SFRH4 calls, so an insurance bid to cap risk is understandable, but this is like toilet paper during covid.
–Ten-year yield was 3.86%, down 13.5 bps at futures settle. SFRZ4 settled 9619 or 3.81%. Perhaps the curve can move to positive carry by the end of the year…
–Payrolls today expected 185k from 216k last. Unemployment rate to 3.8% from 3.7%, Avg Hourly Earnings 4.1%. Powell will be on 60 Minutes this weekend to hone the Fed’s message.
Lean against politicization
February 1, 2024
********************
–Powell said repeatedly the Fed is committed to its 2% inflation target, a direct repudiation of those who would accuse him of easing policy to help someone else defeat Trump. Stocks were already pressured by GOOGL results released Tuesday post-close, and by NYCB opening 45% lower, but the real downside acceleration came after Powell said the central bank is unlikely to have enough confidence about inflation to cut rates as soon as March. SPX ended -1.6% while Nasdaq Comp fell 2.2%.
–The 50/50 level for an ease or hold is 9479.5 on April Fed Funds. (9467 for hold, 9492 for ease). Yesterday’s range was 9476 to 9486.5, but this morning’s trade is 9476.5, closer to the current 5.33% EFFR of 9467.0. The employment part of the dual mandate, which has now become more balanced with inflation in terms of policy implications, will be on display tomorrow with NFP expected 180k. One interesting aspect of Powell’s comments yesterday was a subtle rejection of rules based policy-making. Powell said he leans heavily on anecdotal information gathered from business connections throughout the reserve system. Soft vs hard data.
–The refunding announcement features large increases in 2, 3, 5 and 10y auctions (up $9b per month in 2s and 5s relative to last qtr). 30y bond is only up $1b (attached link below).
–NYCB, the proud buyer of Signature Bank assets, closed down 38% yesterday after a dividend cut. KRE, the regional bank etf closed -5.8%. It was the regional bank crisis in March which sparked a huge short-end rally based on potential rate cuts – which never came. The Bank Term Funding program was instituted at that time to subsidize the banking system back to health. Right after the announcement that BTFP is not being renewed, a lingering flare-up of questionable asset values is again sweeping regionals. Large lay-off announcements and banking issues will clearly keep hopes alive for a March rate cut, though if those factors are the ultimate reason for cuts, stocks likely won’t be cheering the decision.
–Note that the Fed’s dots from the Dec SEP projected 3 eases by year end 2024. SFRZ4 settled 9617.5 or 3.825%, or 150 bps below the current EFFR. The 9700c, 82.5 otm, settled 21.0 with 26 delta. The 9537.5 put, 80 otm, settled 12.0 with 21 delta. That put strike approximately represents three 25 bp eases from the current level. Clearly the market remains attentive to the possibility of bad things happening which will cause big cuts.
–Today’s news includes Jobless Claims expected 212k. ISM Mfg expected 47 from 47.4. Payrolls tomorrow expected 180k. Earnings this afternoon by AAPL, AMZN and META.

