
Powell in the House
June 21, 2023
–Powell today in semi-annual testimony before the House. The objective continues to be convincing the market that an ease is not in near term prospects. However, yields eased yesterday with tens down 5 bps (from Friday) at 3.723%. FFQ3 settled 9473.5 or 5.265% while FFF4 settled -2 at 5.22% vs the current EFFR of 5.08%, so Fed restraint is being priced through year-end. However, FFF5 settled 9622 or 3.78%, up 3.5. More hawkish Fed talk may have a negative impact on stocks, but SOFR pricing tends to reflect a “more tightening now means more easing later” mindset.
–The Monetary Policy Report was released Friday
https://www.federalreserve.gov/monetarypolicy/publications/mpr_default.htm
–Links to testimony in advance of Jefferson and Cook nomination hearings were posted yesterday. From Jefferson: “Inflation has started to abate, and I remain focused on returning it to our 2% target. Despite recent stress, the US banking system is sound and resilient, and I remain attuned to any threats to its stability.” From Cook: “…elevated inflation is a grave threat to sustaining the expansion of the American economy. Therefore, in my role as a voting member on the Federal Open Market Committee (FOMC), I have been consistently supportive of our rapid and forceful actions to tighten monetary policy and bring inflation down. If confirmed, I will stay focused on inflation until our job is done”.
–Call buying continues, though yesterday a purchase of SFRU3 9550c for 5.5 (settled 5.0 ref 9467) was a short cover. I have added a chart of SFRZ3 9650 c which were heavily bought last week. Open interest went from 314k on June 12 to 435k coming into yesterday. That’s the most OI of any call or put in SOFR, settled 7.75 ref 9480.5. However, SFRZ3 9500p , which are 19.5 in-the-money with -0.59 delta, have 409k open, settled 44.75. In terms of risk reversals, SFRZ3 9425p, 55.5 out-of-the-money settled 7.75 with -0.20d, while the 9537.5c, 57 out, settled over 2x higher at 18.0 with +0.29d.

Need a nap? Check out Liberty Street Economics
June 19, 2023
–Friday featured new recent high SFRU3/SFRU4 at -124 (9469/9593). SFRZ3/Z4 still most inverted 1-yr at -142.5 (9481.5/9624) as Fed dots indicate 100 bps of ease over 2024 (5.6 to 4.6 FF target). Longer curve measures made new lows: 2/10 treasury spread at -95.6 and 5/30 at -14.4.
–Powell hones his message in front of Congress this week, House on Wednesday and Senate on Thursday.
–On Friday the NY Fed [Liberty Street Econ] released its DSGE Model Forecast. Which, as everyone knows, stands for Dynamic Stochastic General Equilibrium. (duh) It revised growth estimates sharply higher…but cited just ONE factor: “SPF [survey of professional forecasters] long-term inflation expectations have dropped by about 45 bps in Q1 23, relative to Q3 2022, a very large change by historical standards.”
Asked for further clarification, a representative from the NY Fed said, “Dude, it’s just a model.”
Appears to be in sync with NY Fed’s UIG, below
—
From the NY Fed Underlying Inflation Gauge:
The UIG “full data set” measure for May is currently estimated at 3.5%, a 0.5 percentage point decrease from the current estimate of the previous month.
The “prices-only” measure for May is currently estimated at 3.0%, a 0.4 percentage point decrease from the current estimate of the previous month.
To the untrained eye, it certainly LOOKS like a turn…

https://www.newyorkfed.org/research/policy/underlying-inflation-gauge
Keeping at it
June 18, 2023 – Weekly Comment
************************************
According to the old way of doing things, this coming week SFRU4 would become the first red. On BBG, given that the SFRM3 contract remains listed, the first red will become SFRM4. It doesn’t matter, for the purposes of this note we consider the forward packs which are one and one-quarter year forward, and two and one-quarter years forward, which I call the red and green sofr packs, and start with September.
From Powel’s press conference:
…it will be appropriate to cut rates at such time as inflation is coming down really significantly. And again, we’re talking about a couple of years out. I think as anyone can see, not a single person on the committee wrote down a rate cut this year, nor do I think it is at all likely to be appropriate if you think about it. Inflation has not really moved down. It has not so far reacted much to our to our existing rate hikes. And so we’re going have to keep at it.
I believe Powell’s main objective has been to convince economic participants that funding rates are going to stay high. It’s not really the level, it’s the duration. It is already the case that the FF rate has surpassed every measure of annualized inflation except for CPI ex-food and energy which was 5.3% at last print, vs the FF target range of 5.0-5.25%. The headline CPI number was 4.0%, PCE deflator 4.4%, Core PCE 4.7%, NY Fed’s Underlying Inflation Gauge ‘full data’ 3.5% and ‘prices only’ 3.0%. Avg Hourly Earnings yoy is 4.3%. The signal the Fed used to impress upon the public that they’re serious this time!, is the rise in the Fed Fund forecast according to the ‘dot plot’. For the end of 2023 the dot was raised to 5.6% from 5.1%, indicating the possibility of 2 more hikes, and the end-of-’24 dot was raised to 4.6% from 4.3%.
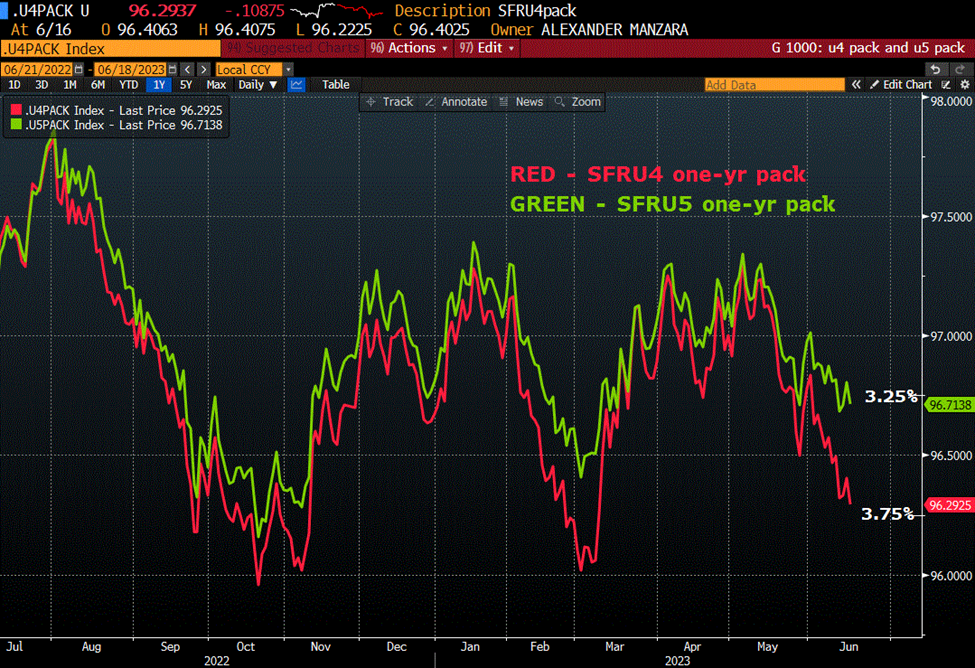
Let’s look at the weekly changes of the new red pack (U4 one-yr) and green pack (U5 one-yr). SFRU4 pack fell 17.5 bps on the week from 9646.75 to 9629.25 (low since SVB). SFRU5 pack fell nearly 9 from 9680.625 to 9671.75. The 2-yr note rose 12.7 bps from 4.602% to 4.729%. During this calendar year, the range on the U4 pack has been 9733.75 (~2.66%) to 9601.375 (~3.99%). Friday’s close ~3.71%. So the Fed has succeeded in nudging up this forward rate even as inflation data have softened. However, the forward rate is STILL 137 bps below the current Fed Effective of 5.08%. I.e., we’re NOT “…talking about a couple of years out.” The green pack is 180 bps under current EFFR.
Inversion is already long in the tooth
The 2/10 treasury spread ended the week at -95.5 bps. It has been consistently inverted (below -15 bps) since July 2022, and is nearing the low for the year (-109). That’s nearly a full year of inversion. In the mid-2004 to 2006 hiking cycle the LOW of this spread was -19 bps in Nov 2006, five months after the last hike. It didn’t turn consistently positive until June ’07, followed by the first ease in September. The duration of time the spread was consistently under +5 bps was a year, June’06 to June ’07. In the year 2000 the spread was inverted through that calendar year with a low of -56. It flipped positive right at the start of 2001. The Fed had hiked from 4.75% in June 1999 to 6.5% in May 2000; the first ease occurred right at the start of 2001 as the dotcom bubble began to implode. The duration of inversion at that time was eleven months, from Feb 2000 to the start of Jan 2001.
There’s an insightful tweet from Steph Pomboy @spomboy 6/11
“…Every day that the Fed holds rates here is another day an adjustable rate mortgage resets, a corporate bond matures or a floating rate lev loan notches up. Every day is tightening. And by the time the fed DOES cut, mkts will be tightening on deteriorating credit quality.”
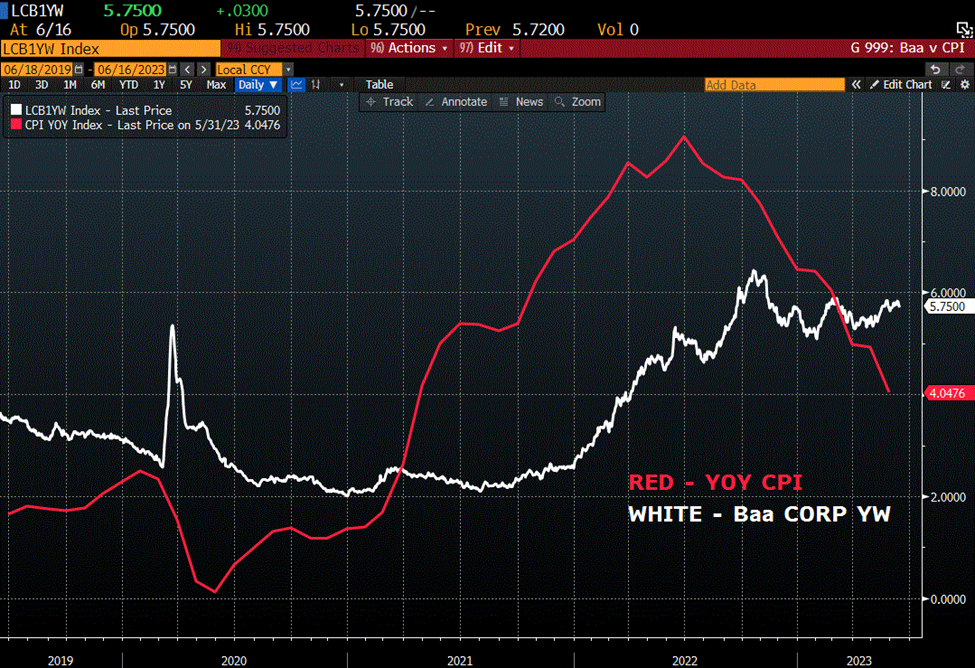
If the Fed lengthens the duration of the curve inversion and continues to jawbone forward rates somewhat higher, then “every day is a tightening.” Perhaps another chart that helps emphasize this idea is the following, inflation vs the corporate Baa yield. If one considers the inflation rate as a general increase in the prices of output then as inflation exceeds the corporate bond rate, there is a huge incentive for companies to borrow and expand. It’s analogous to positive carry. Borrow at a rate below inflation and sell at prices that continue to rise. But if inflation falls below the corporate bond rate, that incentive disappears. An inverted curve suggests much the same, inasmuch as long term yields represent future potential growth.
Next year is the election. Loan delinquencies are already on the rise. A Barclay’s note suggests that reimposition of debt servicing payments on student loans could have an impact of as much as $15.8 billion per month, which will negatively impact retail sales. I seriously doubt the headwind will be that strong; many of those loans simply won’t be paid and will be perpetually extended without serious collection efforts. The broad point is that previous Fed hikes are still working through the system, and credit conditions are tighter than they were previously. Impediments to growth could still be offset by increased government spending as the election nears, but the duration of the current curve inversion suggests that growth will soon falter and easing isn’t as far off as Powell would like to believe.
Powell delivers semi-annual testimony to Congress this week, appearing before the House on Wednesday and the Senate on Thursday. 20 year treasury auction on Wednesday, $12 billion.
| 6/9/2023 | 6/16/2023 | chg | ||
| UST 2Y | 460.2 | 472.9 | 12.7 | |
| UST 5Y | 391.6 | 400.2 | 8.6 | |
| UST 10Y | 374.1 | 377.3 | 3.2 | |
| UST 30Y | 388.4 | 385.8 | -2.6 | |
| GERM 2Y | 291.6 | 312.3 | 20.7 | |
| GERM 10Y | 237.7 | 247.4 | 9.7 | |
| JPN 30Y | 125.3 | 122.8 | -2.5 | |
| CHINA 10Y | 269.0 | 267.9 | -1.1 | |
| SOFR U3/U4 | -136.0 | -124.0 | 12.0 | |
| SOFR U4/U5 | -64.5 | -70.5 | -6.0 | |
| SOFR U5/U6 | -6.5 | -15.5 | -9.0 | |
| EUR | 107.50 | 109.45 | 1.95 | |
| CRUDE (CLQ3) | 70.33 | 71.93 | 1.60 | |
| SPX | 4298.86 | 4409.59 | 110.73 | 2.6% |
| VIX | 13.83 | 13.54 | -0.29 | |
The Fed projects 100 bp ease in ’24, the market projects 150
June 16, 2023
–Yields declined in the wake of the FOMC, even though the dot plot suggests more tightening this year, and Fed officials are likely to try to jawbone their inflation resolve. According to FF futures settlements, FFQ3 to FFF4 is -6.0 (9475.5/9481.5), so there is no hiking priced, but the market is giving the Fed the benefit of a doubt in terms of holding rates steady. The end-of-2023 FF dot was 5.6 and end-of-2024 was 4.6. The 100 bps of ease (after the supposed hikes this year) is then essentially priced by the FFF4/FFQ4 spread which encompasses the first 5 FOMC meetings and settled -92.5 (9481.5/9574). New lows red pack to deferred, with reds/greens -62 bps. 2/10 treasury spread at -92. Ten year yield fell 7.6 bps to 3.726%. The lowest one-yr calendar on the SFR strip is Z3/Z4 at -150.5; more aggressive in terms of ease projection than the Fed.
–Waller speaks this morning at 7:46 ET.
–A lot of SFRZ3 calls bought yesterday: another 100k 9650 calls; settled 7.75 vs 9484.5. Also buyer of at least 15k 9550/9600cs from 5.2 synthetic to 5.5. Buyer of 20k SFRH4 9650/9750cs which settled 9.5 ref 9518.0 (looks like rolling long calls to lower strike).
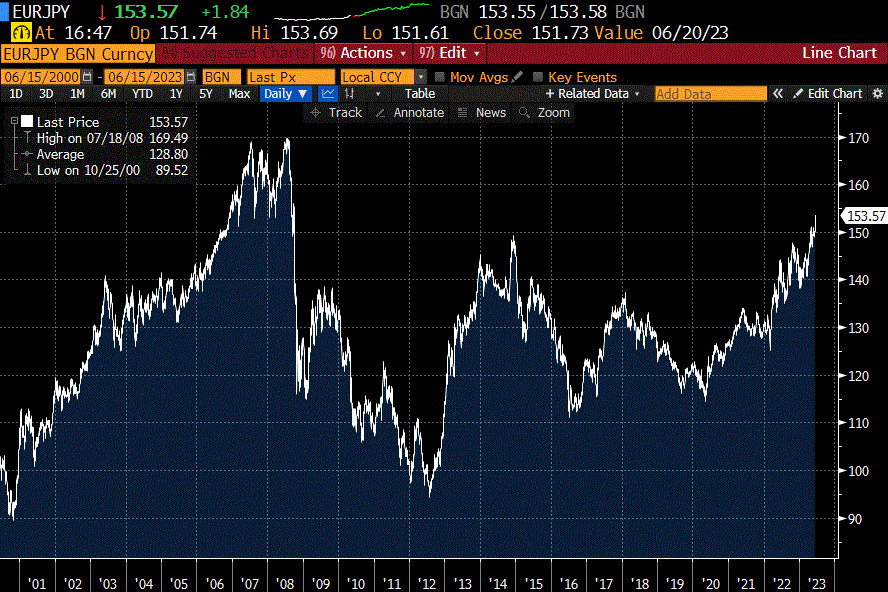
–ECB hike and BOJ maintains easy posture. EUR/JPY yesterday hits 153.60, highest since 2008, and today 154.70. High in 2008, 169.49.
–On Monday floor is closed but screens stay open until noon Chicago time. No official settlements.
Really?
June 15, 2023
–Big surprise out of Fed day was the increase in the dot plot regarding the FF target. The end-of-2023 dot went from 5.1% (projected in Dec and March) to 5.6%, and end of 2024 dot went from 4.3% in March to 4.6%. That effectively conveyed the message that NO EASING is coming this year, and I would bet that Powell lobbied every member to raise their dot forecasts 25 to 50 bps. Change in GDP for 2023 was marked up from 0.4 to 1.0, while unemployment was marked down from 4.5% to 4.1%. PCE inflation down 0.1 from March to 3.2 from 3.3 but Core revised up to 3.6 from 3.3. I guess we’re expecting an acceleration in economic activity? Doesn’t quite hang together. Is the economy that much more resilient (given monpol lags that JP cited)? Sort of reminds me of the Chappelle skit on Jussie Smollett: “…so you went out at 2 a.m. walking in -16 degree weather in Chicago to go to…Subway?” Again, the goal is to convince everyone that no ease is coming this year (even though the dots indicate 100 bps of ease next year). Powell deemed July a “live” meeting and said the risk to inflation is still to the upside.
–PPI yesterday was just +1.1% vs expected 1.5%. Core ex-food and energy was 2.8% vs exp 2.9%. Today we get Retail Sales expected -0.1%. Jobless Claims projected to revert back down to 240k from 261k last. Philly Fed -14 from -10.8 last. ECB this morning. Also, data from China was weaker than expected, but the most interesting note I saw was that “…the jobless rate for 16-to-24 year olds hits 20.8% in May, another all-time high that is four times the national rate which stands at 5.2%”. (ZH). What to do with a bunch of disenfranchised kids that could become a social problem? Send them to war.
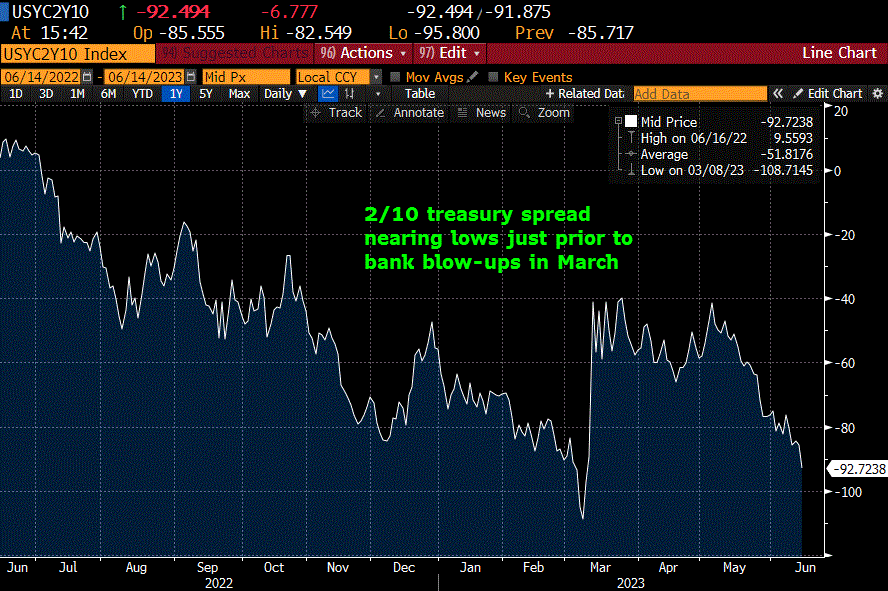
–In terms of market action, near contracts were sold with SFRH4 weakest, settling -6.5 at 9512.5. Given selling in the short end after the much weaker CPI Tuesday. it seems clear that the dot plot projections had leaked prior to yesterday’s FOMC. The curve continued to invert to new recent lows. Attached is chart of 2/10 which was near -93 late, at the same level of late Feb just prior to a spike lower, followed by a surge related to the SVB failure. At futures close 2y +1.1 bp to 4.707% and 10y -3.7 bps to 3.802%. 2/10 is projecting a bad economic forecast, despite the Fed’s rosy scenarios. On Tuesday there was a seller of 100k SFRZ3 9650/9750cs at 4.5; yesterday the lower strike was bought back, paying 6.5 to 7.5; settled 6.5 ref SFRZ3 settle of 9480.5. FFF4 settled around the same level at 9480 or 5.20%. While BBG blares a headline that Powell “indicates at least two more rate hikes…” FFF4 is calling it 50/50 for just ONE more 25 bp hike.
FOMC day
June 14, 2023
–CPI about as expected with a big drop in yoy headline from 4.9% to 4.0%. FFM3 settled +2.25 at 9490.75 or 5.0925%, very close to the current EFFR of 5.08 and FFN3 settled 9487.0 or 5.13%. These settles indicate high market confidence of a Fed ‘skip’ today. FFQ3 settled 9474.5 or 5.255% so there’s a lean towards another 25 bp hike at the July 26 FOMC.
–Red SOFR pack was crushed despite favorable CPI, settling -17.5 at 9607.625. SFRZ3 settled -9.0 at 9486.5 or 5.135%; open interest in the contract fell 35k, so it feels like long liquidation. Implied vol fell. On Friday SFRZ3 9500^ settled 75.5 vs 70.75 yesterday while the 9487.5^ settled 72.25 Friday and 66.5 yesterday. There was a seller of 100k SFRZ3 9650/9750cs at 4.5 ref 9495, settled 4.0 (7.5/3.5) with open interest +86k in the lower strike and down 35k in the upper, so it’s a roll down. There was also what appears to be an exit seller of 40k SFRH4 9525/9725cs which settled 36.25 ref 9518; open int -24k and -33k. Though short end prices were quite weak, long liquidation and declining vol does NOT suggest a strong trend, rather it signals what is likely to be the end of the move. Having said that, price action yesterday felt as if someone saw Powell’s preparations for the presser, with the vow to hold rates here or higher at least through year end. As mentioned yesterday, the end of 2024 FF dot was 4.3% in March; possible increase today?
–Just looking at SFRU4 prices, in early Feb the contract was 9700. By early March it had plunged to 9570 on tightening fears, then the banking ‘crisis’ hit and by mid-March we were back above 9700. Yesterday’s settle was 9598, nearly 100 bps below the price one month ago, 9695.0 on May 15. So there have been several moves over 100 bps in the past four months. Midcurve Sept options (0QU3) expire in three months on 15-Sept. Worth looking at buying some call spreads? 0QN 9650/9700cs settled 4.25. 0QQ 9650/9700cs 7.0 and 0QU at 8.75.

Image is CPI index; clear deceleration in trend since mid-2022. A lot of people mistake a high cost of living with inflation. A shift to a higher cost of living is painful, and will likely continue to be painful, but a leveling off of high prices, even though still high, means significantly less inflation.
Dots and Dissent
June 13, 2023
–How does the Fed ‘skip’ but convince the market that easing is a long way off? Powell can convey that message at the press conference. Could a change in ‘dots’ in the SEP help? In both December and March the end-of-2023 dot for FF was 5.1%. The Fed has reached that goal. I think it’s rather unlikely that the ’23 dot could move up, though 7 members had estimates above 5.125 in March: 3 at 5.375%, 3 at 5.625% and 1 at 5.875%. Somewhat hard to move that needle. However, moving the end-of-2024 dot up might send a message. The dots were diffuse in March, from 3.375% to 5.625%. Could this dot move to 4.625% as a median? It was 4.1% in December and 4.3% in March. I think it’s possible, though not likely. What about dissents? I think there is a small chance of dissent by Logan, Waller and Bowman. All appear concerned that inflation remains too high.
Waller on May 24: On Friday, we will be getting April inflation data based on personal consumption expenditures and then May CPI data on the first day of the FOMC meeting. These are two critical pieces of data I will be looking at between now and the June FOMC meeting to learn more about inflation dynamics and if we are seeing some easing in inflation pressures.
Logan on May 18: As of today, though, I remain concerned about whether inflation is falling fast enough.
Bowman on May 12: Should inflation remain high and the labor market remain tight, additional monetary policy tightening will likely be appropriate to attain a sufficiently restrictive stance of monetary policy to lower inflation over time. I also expect that our policy rate will need to remain sufficiently restrictive for some time…
–CPI today expected 4.1 yoy vs last at 4.9. There’s a projection of a much lower number next month by Credit Suisse due to base effects. Core CPI expected 5.2 vs 5.5. China cut its 7-day repo by 10 bps today, CNY trades 7.15 its weakest level since last November, with Xi continuing to advise the Chinese to prepare for ‘worst case’ scenarios. Financial Times today leads off with this headline: ‘US junk loan defaults surge as higher interest rates start to bite. Total this year exceeds 2021 and 22 combined…’
–Current EFFR (Fed effective) is 5.08%. On a hike it will move to 5.33. FFQ3 settled yesterday at 9469.5 or 5.305%. So even with talk of a skip tomorrow, the market leans heavily toward a hike either Wednesday or July 26. SFRM3/SFRU3 settled at a new recent high of -0.5 (9473/9473.5). A month ago on 11-May the spread was -36 (9494.5/9530.5). The Fed has successfully conditioned the market to believe there will be no ease through Q3, at least. “Sufficiently restrictive.” Further out, SFRZ3/Z4 one-yr calendar settled -149.5 (9495.5/9645), projecting significant easing over that year. Dec’23/Dec’24 is the most inverted one-yr calendar on the strip. Can the Fed prevent runaway easing of financial conditions (most notably a ripping stock rally)?
–July WTI (CLN3) was 67.24 late yesterday, down 2.93 and getting nearer to the lowest level of this year, which was just over $64/bbl.
The Last
June 11, 2023 – weekly comment
**********************************
“Every trail has its end, and every calamity brings its lesson”
James Fenimore Cooper – The Last of the Mohicans
A week from Monday will be the final settle of the last Eurodollar contract, EDM3. Eurodollar futures settle to three-month libor. As I recall, the survey question for final settlement was, “Where do you perceive the three-month offer rate to the best credits in the market?” It is an anachronism now, because of course the Fed backstops the biggest banks.
Above is a chart of 3-month libor. The top was 5.725% in September 2007. In the summer of 2006 (the last hike had been June 2006 to 5.25%) the libor settings were 5.50 to 5.52%. On Friday, the setting was 5.544%. Everything is almost exactly where it was at the top of the 2006 cycle. There’s a certain amount of symmetry here.
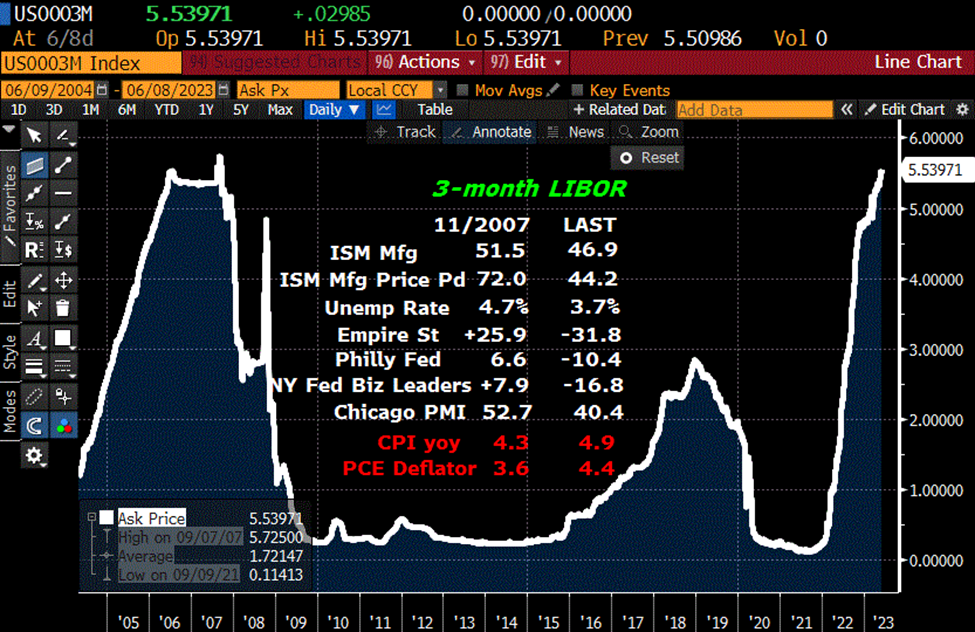
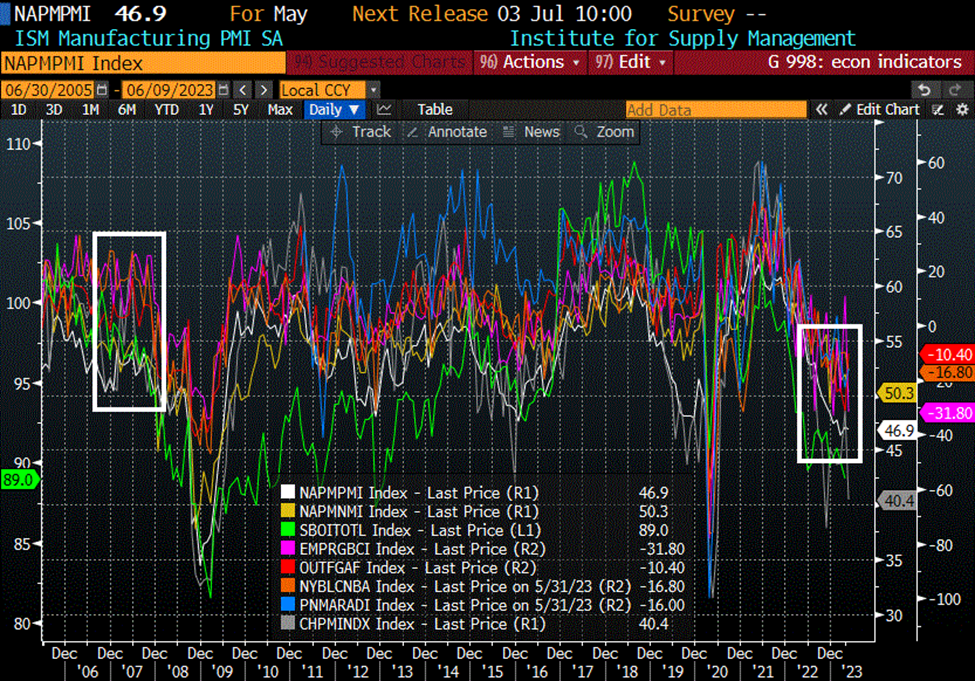
Someone had posted on twitter that when economic indicators are as weak as they are currently, the Fed is typically already easing. On the libor chart above, I list several such economic data points, and on the (busy) chart below I graph the data. Everything is weaker now than at the start of easing in 2007. EXCEPT, the unemployment rate now is significantly lower and inflation is higher. I.e. stagflation. One other point that bears mention. From June 2006 (last hike) to Sept 2007 (first ease) the ten year yield ranged from 4.5 to 5.25%. From Sept 2022 to now, the range in the ten year has been 3.375 to 4.25 (last at 3.74%). In that sense, perhaps the long end has already reflected easier conditions.
In the 2004-06 hiking cycle, SPX generally rallied. In 2007 it was clear there were problems in the mortgage markets, which the Fed deemed “contained”. On October 2007, SPX posted its high of 1565 (this was right after the first ease). By March 2009 SPX had lost 57%, bottoming at 676. Beware of the idea that Fed easing signals an “all-clear” with respect to stocks. The Fed eases when things are veering towards calamity.
This coming week has a lot packed in. On Monday and Tuesday are auctions: Monday: $58b 26-week bills, $65b 13-week bills, $40b 3-yr note, $32b 10s. Tuesday: $38b 52-week bills, $45b 42-day cash mgmt. bills, $18b 30-yr bonds. CPI is released Wednesday, expected 4.1% from 4.9% last, with Core 5.3% from 5.5%. NFIB Small Business Optimism expected 88 from 89. I believe the Fed will pause at this meeting and it will mark the end of the hiking cycle. However, I would guess that Powell will continue to project a hawkish outlook at the press conference. The goal is to convince the market that policy will remain tight, and that an ease will NOT occur this year. They’ve been pretty successful on that score after the March banking flare-up; SFRZ3 was 9575 in early May and is now below 9500.
The dot plot should be interesting. At the March SEP:
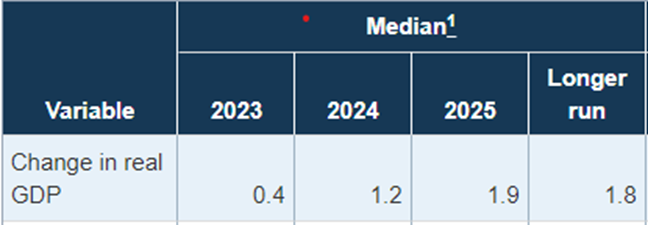


With SFRZ3 9496.5, it’s just a few bps from the year-end projected funds rate of 5.1%. SFRZ4 is 9642.0 or 3.58%, which is still quite a bit lower than the year-end ’24 projection of 4.3%. But SFRZ5 at 9680.5 or 3.195% is pretty close to the year-end ’25 projection of 3.1%. As of Friday, it appears as if the Fed has quite deftly guided the market towards its projections, outside of 2024. And even there, it’s worth noting that SFRZ4 has sold off by more than 80 bps in the past month.
OTHER THOUGHTS
When the CME floor was in its heyday it was a fantastic place to work. They called it highschool with a paycheck, but I always thought it would be hard to find such a wide spectrum of people crammed onto one floor, from pure idiots to geniuses, and a lot of street smart kids. There were plenty of insults and humiliation to go around. But, as the era of the eurodollar future draws to a close, I’ll just share a more human side of the pit.
A woman who had been working as a trade checker for a long time, had gotten backing for a seat. Trade checkers represented one or more pit traders and literally collected trading cards from them and confirmed trades during the day with other clerks (quantity, price, contract month). Anyway, this woman finally goes into the front month eurodollar pit as a trader, (we’ll call her Michelle). What happens the first day? One trader after another says “hey Michelle, you 8 bid? I’ll sell you 25. You at 9? I’ll buy 25.” That of course, was a trade infraction, but it was also a nice welcome to someone who worked their way up. By the way, that was not the case for someone who was trying to enter the pit and attempt to claim space as a new broker/local. I remember seeing a guy walk out of the pit bloody and sweaty because he was trying to take someone else’s floor spot, and he was not a small man.
Below is a constant maturity chart of the 3rd/7th/11th quarterly SOFR contract butterfly. Currently, that’s SFRU3 9476.0, SFRU4 9612.0, SFRU5 9676.5. So the butterfly is U3/U4 spread = -136 minus the U4/U5 spread = -64.5 or -71.5. This year has been sort of a roller coaster. From mid-Jan to March the fly went above 0 as the red (7th) contract sold off harder than the others. After SVB the fly plunged as the red contract outperformed to the upside. Now the fly is rallying again as the reds have led the sell-off since early May. I would be inclined to sell U3/U4/U5 if it can approach -55 to -50.
| 6/2/2023 | 6/9/2023 | chg | ||
| UST 2Y | 450.1 | 460.2 | 10.1 | |
| UST 5Y | 384.5 | 391.6 | 7.1 | |
| UST 10Y | 369.5 | 374.1 | 4.6 | |
| UST 30Y | 388.9 | 388.4 | -0.5 | |
| GERM 2Y | 279.6 | 291.6 | 12.0 | |
| GERM 10Y | 231.1 | 237.7 | 6.6 | |
| JPN 30Y | 126.5 | 125.3 | -1.2 | |
| CHINA 10Y | 271.5 | 269.0 | -2.5 | |
| SOFR U3/U4 | -156.0 | -136.0 | 20.0 | |
| SOFR U4/U5 | -52.0 | -64.5 | -12.5 | |
| SOFR U5/U6 | 0.5 | -6.5 | -7.0 | |
| EUR | 107.08 | 107.50 | 0.42 | |
| CRUDE (CLN3) | 71.74 | 70.17 | -1.57 | |
| SPX | 4282.37 | 4298.86 | 16.49 | 0.4% |
| VIX | 14.60 | 13.83 | -0.77 | |
NAPMPMI = ISM MFG
NAPMNMI = ISM Services
SBOITOTL = NFIB small biz optimism
EMPRGBCI = Empire State
OUTFGAF = Philly Fed
NYBLCNBA = NY Fed Biz Conditions
PNMARADI = Philly Fed Services
CHPMINDX = Chicago PMI
Shifting into reverse
June 9, 2023
–Rates declined in a flattening trade as Jobless Claims came in at 261k, the highest level since Oct 2021. Two-yr note fell 2.7 bps to 4.517% as tens eased 6.6 to 3.714%. While SFRZ3 trades near 5% at 9503.5, easing in 2024 is still being significantly priced. For example, Jan’24 FF settled 9499.5, or almost 5%, while August’24 is 9598.0 or near 4%; there are five FOMC meetings between those two contracts.
–Headline from this morning’s WSJ: More Startups Throw in the Towel, Unable to Raise Money for [stupid] Ideas. Ok, the stupid part wasn’t in there, I took some editorial license on that one.
–China PPI was down 4.6% the most rapid drop since Feb 2016. Re-CLOSING?
–From ZH this morning regarding Commercial Real Estate: “According to real estate data firm Trepp, more than 4% of office loans packed into commercial mortgage-backed securities were delinquent in the last 30 days as of May, the highest level since 2018.” …“This is just the tip of the iceberg for office delinquencies as $35 billion in CMBS office loans are scheduled to mature this year and the refinancing market is effectively shut to this asset class.”
–Next week three and ten year auctions are Monday and the 30-yr is Tuesday. CPI is released Tuesday and the FOMC meeting is Wednesday.
Canada hikes, China paving the way for a cut
June 8, 2023
–Bank of Canada raised rates yesterday to 4.75% from 4.5%, but today China’s six state-owned banks cut deposit rates…reducing the rate for 5-yr time deposits to 2.5% from 2.65%. (CNBC). According to Nomura, “This new round of deposit rate cuts, as well as rapidly worsening exports, broadening property distress, ongoing disinflation and a likely Fed pause, raise our conviction of this call on rate cuts” (looking for PBOC to cut 10 bps).
–The Canada move spilled into US rates, but it was nearly a parallel shift higher: red sofr pack -7.125 bps while the ten year treasury rose 8.3 bps to 3.78%. Weakness in USU3 continues this morning with last of 126-04 vs settle 126-16. Low of the move on May 26 was 125-09.
–New buyer yesterday of 15k TYU 110p for 32 covered 113-05, settled 31 vs 113-07. On the SOFR side a buyer of about 45k SFRZ3 9600/9700cs for 10 to 10.5, settled 10 vs 9501.5. SFRZ3 traded a low of 9495.5 yesterday. In a way, it’s to the Fed’s credit that this contract has converged with the Fed’s end-of-year FF projection of 5.1%. A month ago the contract was 9575 or 4.25%. It has been a fairly consistent message from Fed officials that rate cuts are not likely this year; the Fed’s guidance has, for once, worked. The end-of-year 2024 FF projection in March was 4.3% while SFRZ4 settled 9649.5 or 3.505%. Large gap there. SFRZ3/Z4 settled -148 and is now the most inverted one-yr calendar on the strip.

