
Rare Leverage
October 12, 2025
******************
The camera pans over a crowded investment conference cocktail party. A sonorous voice asks in near disbelief, “How could all of these sophisticated investors not have seen the warning signs of over-leverage and fraud?”
The broad answer of course, is that some DO see it and actively participate. Really sophisticated ‘investors’ get the info just a little bit before everyone else. It helps. For example, there are reports of heavy short sales of both bitcoin and ether right before Trump’s ‘100% tariffs on China’ announcement on Friday with covers right after the tweet (reported $190m profit). Thanks for link NS.
https://www.youtube.com/watch?v=5fTv9ThJg6U
Thunder clouds are now rolling in threatening forced exits and diminished liquidity. Obviously apparent in crypto, where Bitcoin traded to a record high 126k on Monday, but plunged to around 103k on Saturday, a move of nearly 20% in a week (15% on Friday alone). Ethereum tanked over 25% in the same time period but is still above its 200 dma. (As of this note on Sunday Bitcoin is just above its 200 dma of around 107k). The other related aspect is one of due diligence concerning private credit/equity deals. First Brands bankruptcy highlights lax standards, which will now likely tighten up like a barbed cilice.
Two weeks ago (Ghost of Burns) I mentioned the weak price performance of private equity companies KKR, APO, BX, OWL. All had miserable action on Friday with OWL at the lowest close of the year (below the lowest Liberation Day close) and APO nearing that low (closed 118.22, 4/4 low was 108.68, intervening high in July was 156). I also noted that XBT/XAU (bitcoin gold cross, then at 29) looked vulnerable to a lower break, which of course occurred on Friday. Now at 27.8, it looks like it might test the April low just above 25. (when XBT was 79880 and XAU was 3176).
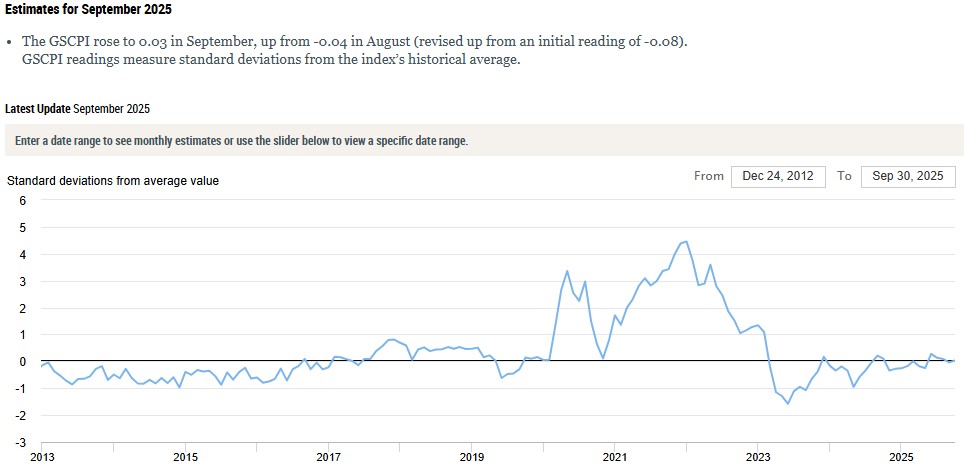
The government shutdown is causing angst over the release of timely economic data, but what is currently reflected in market prices is probably all we need to know. For example, China’s new restrictions on rare earths should have an immediate effect on supply chain pressures, but it probably won’t show up in the NY Fed’s Global Supply Chain Pressure Index for some time. Anduril founder Palmer Luckey is forcefully arguing for the US to move away from China supply chains (which is likely inflationary at the margin). https://www.youtube.com/watch?v=Z369Ug6b83w
Interesting quote: “Most of our best talent…contrast this to the Cold War, is no longer working on nat’l security problems, but is working on things like advertising optimization, on new apps, on tools of entertainment rather than tools of deterrence. And I’ve seen that reversing.”
Here’s NY Fed Supply Chain Pressure. It surged during Covid. How will a suspension of rare earths impact supply chains in general?
https://www.newyorkfed.org/research/policy/gscpi#/interactive
In my opinion it won’t be easy to reverse Friday’s damage in stocks due to continuing erosion of the administration’s credibility. Even with softened rhetoric, consumer and business confidence is likely to fray further. So, I think the Liberation Day sell-off (sans the subsequent rally) is the proper template. SPX low print in April was 4835 (start of the year was around 4745). Friday was 6552.
The Liberation low print in SPX was ~21% below February’s high, and about 16% below the late March high (immediately prior to the April 2 Liberation Day tariff announcement). From Thursday’s close of 6735, 16% lower is 5657 and 21% is 5321. The 100 dma is 6327 and the 200 day is 6050. At the very least I would say the 200dma should be tested, which is about 7.5% lower than Friday’s close.
The peak SOFR futures contract is SFRH7 at 9701. High tick in that contract just prior to the September 17 ease was 9719.5. SFRH7 is now the second red. In the Liberation turmoil, the second red traded as high as 9728, though the high settle was 9693.5. The highest settle for the second red on April 30 (SFRU6 at that time) was 9706. The high in the red pack in April was 9702. Given the 25 bp ease in September and expected 25 bp cut in October, 9750 should be an easy target for reds if stocks continue to break.
The 10y yield ended Friday at 4.048%, about 4 bps below EFFR and 10 below the SOFR rate. On April 4, low in 2y was 3.655, now 3.518. Low in 5y was 3.71 now 3.642. Low in 10s 3.997, now 4.048. 30s 4.411, now 4.63. So shorter maturities are below April’s lows, but longer maturities are not…yet. If 10s move below 4% then 3.79 should be a target. That was the initial low related to the yen-carry trade in August 2024. At the time, the front TY contract traded over 115 (TYZ5 settled 113-045 on Friday).
Themes are 1) tighter credit 2) national insularity that can feed into higher inflation, and 3) a shift to guns rather than butter. The question now is whether the Fed will choose to focus on incipient price pressures (Logan) or on liquidity and wealth effect concerns (Miran)
Powell speaks on Tuesday on the Economic Outlook. Miran on Wednesday. Beige Book Wednesday afternoon. Fed’s communication blackout on October 18.
OTHER THOUGHTS/ TRADES
Both VIX and MOVE perked up last week. MOVE put in low of 69.5 on October 3 but ended Friday 81.65. It’s been in a downtrend since the April spike up to 140. Excluding any adjustments which may have occurred, the large covered call buyer in TYZ5 is getting close to flat after suffering the vol grind lower.
I have included a summary of Dec TY covered calls that had been accumulated in the latter half of September. Again, this is not necessarily inclusive, and doesn’t assume any adjustments. However, the changes from last Friday, October 3, to October 10 settles are somewhat enlightening. Shown at bottom
Summary of TYZ covered call buys (not sure this is a complete list, added the 113c 9/30):
Monday 9/22:
+50k TYZ5 114.0c covered 112-275, 31d price 33
+50k TYZ5 114.0c covered 112-255, 29d price 32
+25k TYZ5 114.0c covered 112-240, 28d price 31
Tuesday 9/23:
+50k TYZ5 114.0c covered 112-250, 29d price 31
Thursday 9/25:
+50k TYZ5 113.5c covered 112-215, 35d price 38
+50k TYZ5 113.5c covered 112-210, 35d price 38
+20k TYZ5 113.5c covered 112-090, 18d (only) price 32
Tuesday 9/30
+50k TYZ5 113.0c covered 112-190, 42d price 46
+25k TYZ5 113.0c covered 112-220, 45d, price 49
Friday’s settles, Oct 10, 2025: (Dec options expire 21-Nov)
TYZ5 113-045
TYZ5 113.0c 57
TYZ5 113.5c 43
TYZ5 114.0c 32
| 10/3/2025 | 10/10/2025 | chg | ||
| UST 2Y | 357.0 | 351.8 | -5.2 | |
| UST 5Y | 370.6 | 364.2 | -6.4 | |
| UST 10Y | 411.7 | 404.8 | -6.9 | |
| UST 30Y | 471.2 | 463.0 | -8.2 | |
| GERM 2Y | 201.5 | 195.7 | -5.8 | |
| GERM 10Y | 269.7 | 264.3 | -5.4 | |
| JPN 20Y | 261.1 | 270.8 | 9.7 | |
| CHINA 10Y | 185.9 | 184.7 | -1.2 | |
| SOFR Z5/Z6 | -62.0 | -64.0 | -2.0 | |
| SOFR Z6/Z7 | 11.0 | 11.0 | 0.0 | |
| SOFR Z7/Z8 | 19.0 | 18.5 | -0.5 | |
| EUR | 117.42 | 116.06 | -1.36 | |
| CRUDE (CLZ5) | 60.53 | 58.48 | -2.05 | |
| SPX | 6715.79 | 6552.51 | -163.28 | -2.4% |
| VIX | 16.65 | 21.66 | 5.01 | |
| MOVE | 69.53 | 81.65 | 12.12 | |

