Reflation
May 10, 2020- Weekly Comment
This week I am starting with a link to the macro letter by Paul Tudor Jones and Lorenzo Giorgianni, ‘The Great Monetary Inflation’
I skim a lot of financial news sites and what seems to have been distilled by the press from this paper is that PTJ now favors bitcoin as an investment. Yes, that’s part of it. Unsurprisingly the paper is much more nuanced and informative. Below is an excerpt:
Global debt was very elevated entering the pandemic, and this monetary expansion is funding additional large debt creation, for now, without provoking the disciplining response of rising market yields. So far, the result has been asset price reflation. A large demand shortfall will prevent goods and services inflation from rising in the short term. The question is whether that will be the case in the long term with a central bank whose central focus will be repairing the worst employment crisis since the Great Depression.
Rather than do the injustice of trying to sum up the paper, a big part of it has to do with the idea of a possible ‘goods and services’ reflationary environment and the loss in confidence in currency. I am just going to focus a bit on one possible outcome, and that is a steeper yield curve. 2/30 is cited, but I will include 5/30.
First I will note a couple of events in the upcoming week. Treasury auctions 3, 10 and 30 year paper, and on Tuesday adds in Cash Mgmt Bills: $35 billion of 119 days and $65 billion 42 days. Also on Tuesday is CPI. Powell is slated to speak on the economy at 9:00 a.m. on Wednesday.
Regarding treasury auctions, I first went to the TBAC site to see the initially recommended auction schedule for this week. The amounts for 3’s, 10’s and 30’s were $43, $30 and $21b. Total of $94b against maturing amounts of $57b, meaning the treasury is raising $37b in new cash from these three issues. Then I checked BBG for auction amounts: $42, $32 and $22, so $2 billion more than the original estimate, tacked on to the long end. I.e. $39b in new cash. (With a new $20 year on the way). The May 4 Treasury Press Release for borrowing estimates says, “During the April-June 2020 quarter, Treasury expects to borrow $2,999 billion…” I guess that sounds better than $3 TRILLION (or more) right?
Regarding CPI, it’s expected at a month-over-month rate of -0.8%. Hardly matters. Everyone knows there has been demand destruction and many businesses got caught with unsold inventories. Here’s another line from the PTJ piece: “In the last weekly release of the Fed’s Money Stock data, M2 rose 18.5% over a year ago, an unprecedented pace of growth in the history of the weekly time series starting from 1981.” I am going to add another anecdotal thought to the reflation idea. ZeroHedge, to its credit, ran a post from backdoorsurvival.com authored by Samantha Biggers. She’s not famous, or maybe in some circles she is, but in any case wrote an article titled, Staying Ahead of the Shortages: What to Stock Up On for the Coming Year. Crazy prepper right? This is a clear, thoughtful and practical article noting that a lot of basic items are made in China and India, and can be had inexpensively right now, but may go up significantly in price in the near future. Specifically, appliances, clothing, shoes, tires, electronics, power tools, meds, bedding. It’s the same thread of thought that runs through the PTJ piece, but not through the econometric monetary angle, rather, as common sense strategy: As manufacturing comes back to the US prices will increase. [Perhaps wages will as well. I hope so.] Actually PTJ included a line that alluded to the same thing regarding supply chains. Maybe these reflation thoughts and changes in consumer behavior aren’t just at the margin, but are at the cusp of Malcolm Gladwell’s ‘The Tipping Point’: The moment of critical mass, the threshold, the boiling point.
Powell will speak on Wednesday. After an historic week where prices of Fed Fund futures traded above 100, i.e. at negative rates, this should be a big day. Many Fed officials have noted that negative rates have not been particularly beneficial in Europe. The German 2y note has been below zero since 2015 and the 5th euribor contract has been above 100 since the end of 2015. On Friday, when the Fed announced that Powell would be speaking on Wednesday, rate futures immediately downticked. It would be great if Powell put a stop once and for all to the notion of negative rates in the US. But I am sure he won’t. I was reading an article on Reuters which had this asinine segment: “Negative rates also result in cheaper mortgages, which attract new home buyers. They allow existing home owners to refinance loans at lower rates, reducing their debt obligation. Consumers can borrow at cheaper rates to finance other large purchases such as cars or home appliances.” Oh. I see. It’s all wonderful then right? Rates go negative in a vacuum where income and credit quality just stay exactly where they were. Maybe rates are going negative because hopeful ‘new home buyers’ don’t have jobs. The article implies that we can buy toys and second homes and just charge it. It’s American medicine. Not “What are the core catalysts that made you ill that can be changed or avoided?” It’s, “You’re sick. Let’s give you a pill to ameliorate some of the symptoms.” Capitalism is basically healthy. Sometimes things don’t work. They fail, and new opportunities sprout up which draw resources. The healthy system adapts. The zombie system doesn’t. Anyway, I digress…
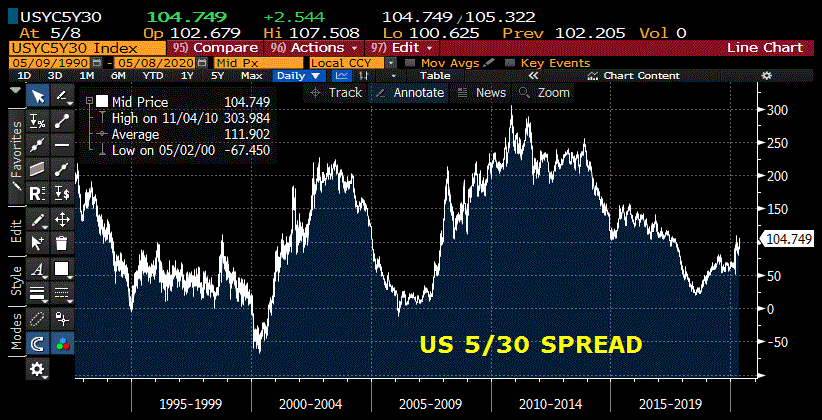
On July 13 of last year my weekly note was titled ‘Often Wrong, Never in Doubt’. I focused on 5/30 and posited my thesis of higher levels. “I know which way it’s going. Higher. And I know where. To 150 for a start. (Currently 78). It started the year at 48, having closed at 36 on Dec 20, 2018, the day after the last hike.”
Well it ended this week at 106 and never reached my initial target of 150, having spiked briefly to 110 last month. I was wrong in the middle of last year, as 5/30 languished around 55 to 65 through year-end. But I am jumping back on the horse. Typically the curve steepens on rate cuts as these decreases are thought to spur future inflation and growth. In the current situation, some would argue that we’ve HAD the cuts, and now the only stimulus left is lower long end rates, resulting in an even flatter curve. I would argue that while we’ve had FF cuts, it’s only over the past month, as libor dropped from 145 bps to 44 bps, that the market’s attention was captured by lower funding rates. Further, the amount of supply, marginally increased at the long end, is simply staggering, and that’s at both the corporate and government level. As Jones’ paper says, “Corp debt is also rising briskly to record levels as firms draw down revolving credit lines to self-fund cash flow shortfalls.” The monetary aggregates outlined by PTJ are, of course, another huge factor. There is another point I would like to make that may also serve to support the idea of a steeper curve. At the start of the last crisis, corporate debt wasn’t all that high. According to the Fed’s Z.1 Corp debt in 2007 was $6.3T. At the end of 2019 it was $10.1T. By contrast HH Mortgage debt in 2007 was $10.6T and is now the same at $10.6T. Monetary stimulus had the effect of creating financial asset inflation rather than goods and services inflation. In large measure, corporate borrowing went into stock buy backs and other financial engineering tactics that served to boost stocks. It wasn’t too much money chasing too few goods. It was too much investable money chasing diminishing yield (exacerbated and encouraged by the Fed) in a world where boomers were desperate for retirement income. There are two big changes: 1) Income inequality is having a stifling effect on new financial engineering and yields are already low. 2) A decline in corporate credit quality means the window to borrow in order to buy back shares has shut. 3) Government cash is not just going to banks, but also directly into the hands of consumers. 4) As global trade declines and fewer dollars filter into the world as US imports stagnate, there may be less foreign demand for US treasuries, leaving domestic players left to mop up the significant excess. I guess those are two big changes in the spirit of, “So here come two words for you…” [Midnight Run]
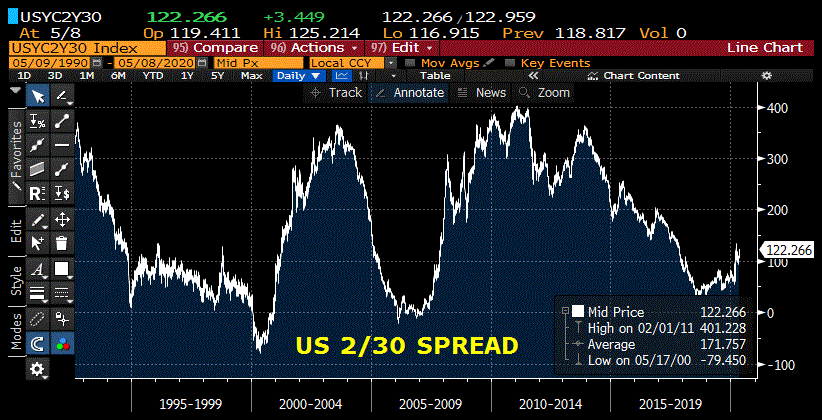
Below is a chart of 2/30 spread. Current 122 bps having peaked around 200 at the start of this administration.

The 5/30 spread is 106 bps as of Friday. It has not seen 150 bps in the past four years. However, both charts have turned up. With the Fed likely to emphasize the forward guidance of low rates, the two-year yield is destined to stay quite low. It ended Friday at just 15 bps. So a significant rise in these yield curve spreads means that the long bond yield has to rise appreciably, which currently seems somewhat unlikely. On the other hand, some people thought VIX could never get much above 20. The 30 year yield averaged around 2.15% for the six months from last August through January. That would represent an increase of more than 75 bps from Friday’s level of 1.38%. In November of 2018 the 30 year yield peaked at 3.45%. It was only one and a half years ago.

The case for a steeper curve isn’t a surge in economic vitality. It’s an avalanche of supply and an increase in inflationary expectations. It’s monetary expansion run amok that saps the confidence of lenders.
OTHER MARKET/TRADE THOUGHTS
This week the two year yield fell 5 bps to 14.9 and 30’s rose 10.5 bps to 138.2. On Wednesday the June Ultra-bond contract WNM0 had the lowest settlement since late March at 218-24. On Thursday rate futures rallied hard. But on Friday, long contracts again sold off, with the Ultra settling 219-29. Bearish. Although Ultrabond options never trade, it’s worth noting that there’s more open interest in WN futures (1.062m) than in the classic bond US (1.003m). In my opinion a close below Wednesday’s low will lead to a quick decline of 10 more points ~205-209. The same set-up in US would lead to a move to around 172/173 vs Friday’s settle of 179-22. June treasury options expire a week from Friday. USM 175/173 p spread settled 9/64’s.
| 5/1/2020 | 5/8/2020 | chg | ||
| UST 2Y | 20.0 | 14.9 | -5.1 | |
| UST 5Y | 36.7 | 32.3 | -4.4 | |
| UST 10Y | 63.9 | 67.8 | 3.9 | |
| UST 30Y | 127.7 | 138.2 | 10.5 | |
| GERM 2Y | -76.0 | -77.8 | -1.8 | |
| GERM 10Y | -58.6 | -53.7 | 4.9 | |
| JPN 30Y | 42.7 | 45.2 | 2.5 | |
| EURO$ M0/M1 | -9.0 | -14.5 | -5.5 | |
| EURO$ M1/M2 | 4.0 | 3.5 | -0.5 | |
| EUR | 109.81 | 109.71 | -0.10 | |
| CRUDE (1st cont) | 19.78 | 24.74 | 4.96 | |
| SPX | 2830.71 | 2929.80 | 99.09 | 3.5% |
| VIX | 37.19 | 27.98 | -9.21 | |
https://www.federalreserve.gov/releases/z1/20200312/html/d3.htm

