Lemons
March 24, 2024 – Weekly Comment
*************************************
The Fed kept three cuts for 2024 in the Summary of Economic Projections (SEP). The Bank of Japan hiked, eliminating the negative funding rate and YCC. The Swiss National Bank eased by 25 bps.
Mohamed El-Erian says this might be the week that Central Banks (with emphasis on the Fed) moved away from a strict 2% inflation target to a broader range above 2%. He notes that Chair Powell dismissed easier financial conditions, a tacit indication of accepting higher inflation. I disagree.
It was August 2020 that the Fed adopted FAIT (Flexible Average Inflation Targeting) seeking “to achieve inflation that averages 2 percent over time.” Obviously, that statement was crafted during a low inflation environment, otherwise we would expect, after recent history, that the Fed would have to undershoot 2% for a while to achieve the average. Powell has repeatedly committed to the 2% target. He speaks Friday in a moderated discussion at the San Francisco Fed; we’ll see if he drops the Fed’s explicit 2% target. I don’t think so. Note that the Fed’s preferred inflation measure, Core PCE prices will also be released Friday when markets are closed for Good Friday. Yoy PCE expected 2.5% from 2.4 last, with Core 2.8% from 2.8% last. Core PCE has been down every month since January 2023. A print above 2.8% would likely elicit bearish headlines.
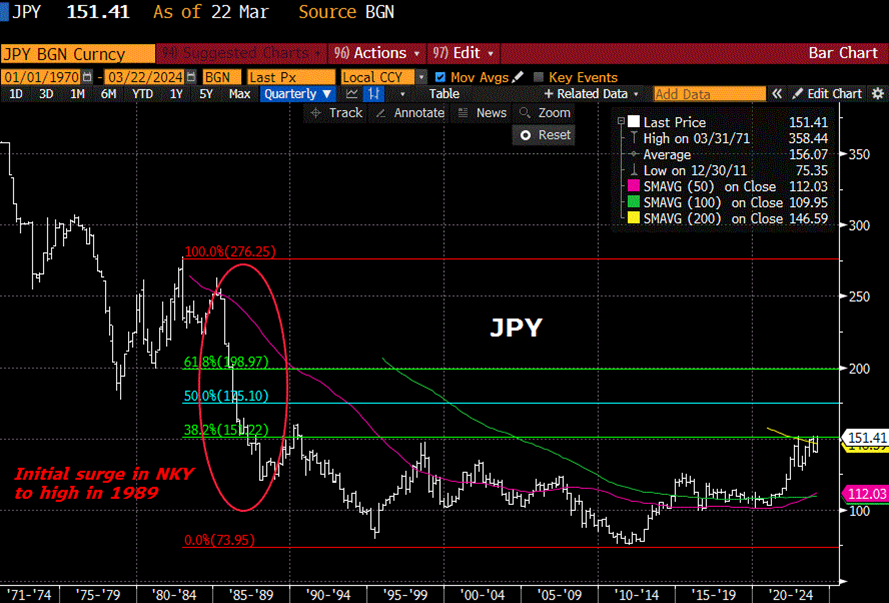
On the topic of financial conditions, I theorized last week that the Fed could dampen long-dated assets, stocks and bonds, by raising longer dated FF dots in the SEP, thus strengthening the perception of higher for longer. That’s exactly what was revealed by the dot plot (2025 FF projection notched up to 3.9 from 3.6 and 2026 to 3.1 from 2.9). However, the market, as usual, focused on short-term relief as the Fed left three cuts in place for 2024 and ignored longer term implications. I have the ‘watch what we do, not what we say’ philosophy regarding financial conditions and the Fed. Although Powell addressed the taper of QT, there didn’t seem to be particular urgency in outlining the plan. Relatively higher funding rates over a longer period should have tightened financial conditions. Perhaps there will be a lag. However, there wasn’t much of a lag with the yen and yuan. After the BOJ’s (dovish) tightening, $/yen made a new high and closed the week at 151.41. DXY also ended at the month’s high. On a long-term chart (below) it looks like 175 might be the next target for JPY. Somewhat interesting to note that the yen soared in the late 1980’s as the Nikkei exploded to new highs. Now it has generally been a weaker yen/stronger dollar that has accompanied the Nikkei’s revisit to the historic 1989 high.
With respect to rates, yields fell on the week but the curve steepened. Twos and fives fell 12.4 bps in front of this week’s auctions of 2s, 5s, 7s. The 10y yield fell 8.5 bps to 4.302%, while 30s eased only 3.5 to 4.426%.
The Fed characterizes monetary policy as restrictive. Many take issue with that assessment. However, the real FF rate, EFFR – CPI at 2.13% is the highest it has been since 2009. For most of the period between 2010 and 2020 the spread was below zero, only briefly positive in 2015 and 2019, but never above 100 bps. Likewise, the ten-yr tip yield poked above 2% this week (ended at 1.87%). This is well off last year’s high of 2.52%, but again, well above every level since late 2009 (high in ’09 1.92%).
I am just going to close with one other indicator of restraint. The image below is Personal Interest Payments. Last of $573 billion annualized.
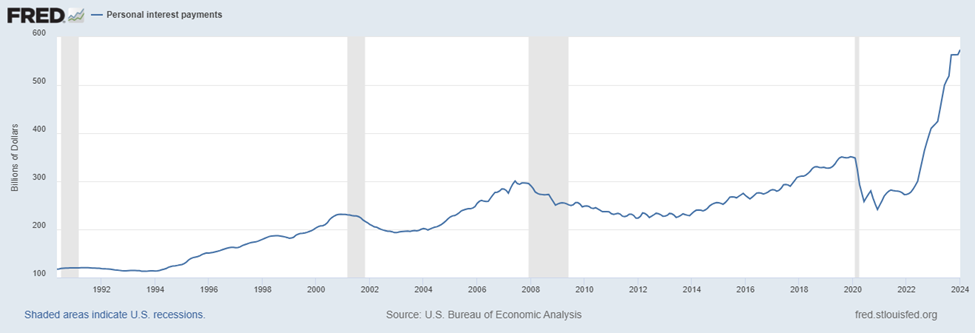
Now, perhaps the level is meaningless when taken on its own. As Yellen might say in her inimitable deadpan cadence, “Wages have also gone up.” So let’s take a look at this value over nominal GDP: This chart starts in 1980, and at first glance, the current level appears consistent with periods around recession. Of course, one might note that personal interest paid looks much like the chart of gov’t interest payments which are a bit over $1 trillion. But those gov’t payments likely benefit a much different segment of the population.

Now I know the Fed has a myriad of consumer strength indicators. Way more than I can ever hope to familiarize myself with. So I’m not sure if this single data point has predictive power.
My more mundane question is, (without the help of AI): Is the woman pictured being stressed on spendable cash? Lulu lemon clothes, CHECK. I-phone, CHECK. Starbucks, CHECK.

Lululemon’s shares dropped 16% Friday on waning North American demand. Many popular consumer brands seem to be experiencing underwhelming sales. I just chose four stocks for the chart below, which are all lower in 2024. Of course, there are many consumer companies that are up on the year, and the ones I selected could be special cases, but perhaps there really is some restraint in buying power, whether engineered by the Fed or not.
OTHER THOUGHTS
While the last few weeks have seen large high-gamma put buys on TY, on Friday the switch flipped to calls.
+50k wk2 110.75c cov 110-18, 37 paid, 0’43s
+8k wk1 111.5c cov 110-155, 11 paid. 0’15s
+20k TYK 114/114.5c stupid cov 110-255, 10 paid, 0’05s and 0’04s
+10k TYM 114.5c 12, 0’11s
Week-2 treasury options expire 12-April, as do April SOFR midcurves. Data encompassed by that period includes:
2/5/7 year auctions this week
3/29 PCE prices and Powell on Friday
4/1 ISM
4/2 JOLTs
4/3 ISM Services
4/5 NFP
4/10 CPI & Fed minutes
4/11 PPI
| 3/15/2024 | 3/22/2024 | chg | ||
| UST 2Y | 472.1 | 459.8 | -12.3 | wi 455.5/55.0 |
| UST 5Y | 432.3 | 420.0 | -12.3 | wi 420.0/19.5 |
| UST 10Y | 430.2 | 421.6 | -8.6 | |
| UST 30Y | 442.6 | 439.1 | -3.5 | |
| GERM 2Y | 294.6 | 282.7 | -11.9 | |
| GERM 10Y | 244.2 | 232.3 | -11.9 | |
| JPN 20Y | 154.8 | 149.2 | -5.6 | |
| CHINA 10Y | 234.7 | 230.9 | -3.8 | |
| SOFR M4/M5 | -101.5 | -109.0 | -7.5 | |
| SOFR M5/M6 | -36.5 | -37.0 | -0.5 | |
| SOFR M6/M7 | -6.5 | -1.5 | 5.0 | |
| EUR | 108.90 | 108.12 | -0.78 | |
| CRUDE (CLK4) | 80.58 | 80.62 | 0.04 | |
| SPX | 5117.09 | 5234.18 | 117.09 | 2.3% |
| VIX | 14.41 | 13.06 | -1.35 | |

