
Three hikes in a year?
October 22, 2021
–Interest rate markets continue to force the issue for hikes, with the red euro$ pack (2nd year) plunging 9.25 bps to an average price of 98.935 or 1.065%. At settlement, EDM’23 was the weakest contract, down 10 on the day to 9884.5. Going into the end of the session it traded as low as -13. This contract has fallen >50 bps since the start of September. Near one-yr euro$ calendar spreads made new highs. The peak is still EDU’22/EDU’23 at 85.5 which rose 3 on the day. The spread before, i.e. EDM’22/EDM’23, was up 5 bps on the day to 80. In Fed Funds, FFN2/N3 (July/July) settled at 74 bps. These year spreads are indicating certainty of 3 hikes starting from the middle of next year. How good are one-year spreads at forecasting actual hikes? I looked back at 2004 to 2006 and even though the Fed hiked at every single meeting for two years (200 bps per year) the ED calendar spreads didn’t fully reflect the consistency of hikes. In my opinion, on the basis of spread levels, one can make a case for buying reds. However, on the basis of actual inflation, buying any interest rate contracts becomes questionable.
–Inflation breakevens are making new highs with the ten yr treasury to tip spread at 2.66%. Powell speaks today; the Fed seems to have toned down the ‘transitory’ argument and now is trying to convince the viewing public that expectations remain solidly anchored at 2%. That is, of course, a fantasy.
–SPX made a new high. The Biden admin is saying tax rates will not be raised. Once again, what we’re seeing in the markets is continued large buys of puts on rate futures. For example, FVZ 121.0p 13 paid for 50k (settled 15 vs FVZ 121-195). Five year treasury made a new high yield on the year, leaping 6.3 bps to 1.21%. In euro$’s 2EZ 9800p were bought in size of 100k for 2.0, ref EDZ’23 9855.5. (settled 2.25 vs 9951.0). There was a large profit-taking sale of 50k EDM2 9962.5/9937.5 put spread at 5.25 (settled 5.5 ref 9964.5). With 3-month libor pegged below 13 bps, and taper expected to end in the middle of next year, EDM’2 at 22 bps above the current libor setting is rather aggressive.
Blues Brothers
October 21, 2021
But you know what it doesn’t have? Chicago cops. Because there are none left.
Bond bids are passive
October 21, 2021
–Energy prices are one of the most easily observed indicators of inflation, and CLZ1 was at a new high late yesterday, trading 83.54, up 1.10. This morning a large chunk of that gain has been given back, with stock futures slightly lower as well. Late weakness yesterday in the long end. TYZ settled 130-205 but traded 14+ late and USZ1 settled 158-04 but slipped to 157-21. This morning they have both edged back up, closer to settles, but as of this note are still negative. The last couple of sessions have seen late selling in the long end, and US vol has firmed to the upper end of the recent range, around 9% in USZ as the attached chart shows. Selling pressure on bonds appears to outweigh bids; yesterday’s 20-yr auction saw underwhelming demand. I marked ten year treasury to inflation-indexed breakeven at a new recent high of 2.59%. Inflation expectations seem to be edging higher.
–Speeches in the last two days by both Waller and Quarles lean toward the view that inflation expectations have not become unmoored. However, comments from both suggest an asymmetric risk. From Waller: “That said, I am still greatly concerned about the upside risk that elevated inflation will not prove temporary.” And from Quarles: “But I see significant upside risks to my current inflation outlook.” How does one hedge against these risks? By buying insurance. Bond puts.
–Today features Jobless Claims expected 297k and Philly Fed expected 25 from 30.7. The most recent reading from the Atlanta Fed GDP Now estimates Q3 growth at only 0.5%, having been more like 3.7% through the first half of September. Now the question is, will the lull in growth due to shortages prove to be ‘transitory’?

************************
From Quarles (10/20/21)Going forward, the question is not only whether inflation will fall in the coming months, but also how far it will fall and if it will fall soon enough to avoid spurring a concerning rise in longer-term inflation expectations. I agree with my FOMC colleagues and most private forecasters that inflation likely will decline considerably next year from its currently very elevated rate. For instance, most of the September Summary of Economic Projections forecasts for PCE inflation in 2022 were between 1.9 and 2.3 percent, with a minimum of 1.7 percent and a maximum of 3.0 percent.3 But I see significant upside risks to my current inflation outlook.
From Waller (10/19/21)
This brings us to another question: Are inflation expectations anchored around our inflation target of 2 percent? Survey measures have shown a dramatic increase in inflation expectations over the past few months. The recent New York Fed measure has short- and medium-term inflation expectations at 5.3 percent and 4.2 percent, respectively. This is eye opening and a genuine cause for concern should households embed these expectations in wage demands. However, market-based measures of inflation expectations and the five-year inflation expectations from the New York Fed survey continue to be anchored near our 2 percent target.
That said, I am still greatly concerned about the upside risk that elevated inflation will not prove temporary.
Send in the Guard!
October 20, 2021
–The curve rebounded somewhat from the hard flattening over the past couple of days. Five year yield fell 0.5 bp to 1.155% while the thirty year rose nearly 7 to 2.087% in front of today’s 20 yr auction. The red/gold pack spread (2nd to 5th year) jumped 8.75 to 96.375, sharply snapping back from Monday’s close of 87.625, which is the flattest the spread had been since the very start of 2021. The red pack (2nd year) was up 4 bps in price, while the gold pack (5th year) was down 4.75. By the end of the electronic session, EDU’24 (green Sept) was up 0.5 while EDU’26 (gold Sept) was down 8. That is to say, it was really the forward back-end contracts which displayed the most weakness. I’m not sure if that continues, but keep an eye on gold midcurve puts. I feel as though there’s about a 20% chance that the bottom falls out of the back end of the curve; owning puts on golds is a limited risk way to express that view.
–Implied vol eased in FV and TY but was stubbornly bid in US, another factor which argues for the idea of long end weakness.
–Reuters reports that “China will curb excessive financing through debt issuance to build high leverages, the Chairman of China’s securities regulator, Yi Huiman, said on Wednesday.” It’s pretty clear that China’s recent moves will further impede growth. As a contrast, it’s reported that the US administration is pondering deploying the National Guard to address supply chain issues. Note to the Fed: that’s when you realize that inflation issues are NOT transitory. Note to everyone else: Time to panic.
Turnaround Tuesday?
October 19, 2021
–Follow through Monday from Friday’s price action. All near euro$ calendar spreads made new highs as hike prospects are brought forward. Back spreads made new lows. Peak on the curve for a one-year calendar is still EDU’22/EDU’23 at 84.5, a new high for any 1-yr calendar this year. Of course, this spread encompasses libor transition, so on an adjusted basis it’s actually lower than EDM’22/EDM’23 which settled 78.5, up 5 on the day (3 hikes in a year). From Friday’s high of 9937.5 to yesterday’s low of 9920.5, EDZ2 fell 17. But nothing compares to moves in short sterling, where near contracts plunged 25 bps yesterday. I’ve included a chart of Dec’21/Dec’22/Dec’23 short sterling butterfly, shown at 61, but that’s an old print…it was 82 yesterday! (That means that the closer one-year calendar is 82 greater than the deferred spread). Up 60 bps since the start of September. Without an actual hike, L Z1/L Z2 has exploded to 76.5 while L Z2/L Z3 inverted to -5.5. It’s an indication that central banks have lost control of the narrative.
–I’ve seen a fair amount of commentary indicating the CB’s can’t do much about supply shocks. When Covid first hit, I didn’t think CBs could do much about THAT, but of course they slashed rates to mitigate the economic fall-out. In part, the Fed’s largesse helped to put conditions in place which accentuated supply shocks, and helped stocks to ‘only go up’. I think some restraint is in order, and the market is forcing the issue.
–On Sept 21, the day before the last FOMC, EDZ’22 was 9957 and the midcurve Dec 9956.25p was 6.0. At yesterday’s low that put was over 35 bps in the money. The move has been so rapid that many targeted put butterflies have exited as the market sliced through middle strikes. A couple of interesting trades yesterday, a seller of 40k 0EZ 9962.5p to roll out and down to buy 0EH 9887.5p, taking in 27 to 27.5. EDH’23 settled 9908.0. There was also a buyer of 50k 0EH 9800p for 1.5. Over 100 bps away with the horses long gone from the barn.
–5/30 closed at a new low just below 86. Thirties are hugging the 2% yield as expected tightening will supposedly slow growth.
Front end implosion
October 18, 2021
–Eurodollar contracts are under continued pressure this morning with EDZ’22 printing a low of 9922.5, 7.5 lower than Friday’s settle (now trades 9925). On Sept 21, the day before the last FOMC meeting, the settle was 9957, so it’s been the equivalent of one full rate hike in less than a month. The red pack (2nd year forward) was the weakest part of the curve on Friday, settling -9.875.
–Crude oil is again making a new high, with CLZ1 printing 82.64, up 91 cents. China’s GDP was less than expected at 4.9%. Stocks are a bit lower, pulling back from the ramp-up into Friday’s option expiration.
–Friday’s price action featured new highs in near euro$ one-year calendars, with EDZ1/EDZ2 up a whopping 7 bps to 51.5. EDM2/EDM3 jumped 6.5 to end almost 25 higher than Dec/Dec at 73.5. Back spreads declined, for example EDM’24/EDM’25 settled at just 22, a new low for the calendar year and 51.5 lower than the near June/June. The market is pressuring the Fed to consider earlier and more aggressive hikes to deal with inflation. It’s gotten so bad that Hooter’s can’t even afford regular shorts for its server uniforms, and has been forced to go with the “smaller package, same price” model.
–The next Fed meeting is November 3, and at the same time the Treasury’s next quarterly supply announcement is released, with expected cuts to 7 and 20 year sizes which will dovetail with the taper announcement. By the way, a twenty year auction occurs Wednesday.
–It’s reported that China successfully tested a nuclear-capable hypersonic missile which caught the US military off-guard. “Taiwan? Why no, I’ve never heard of it.” TSMC manufactures about 50% of all chips sold in the world.
In to the Fall
October 17, 2021- Weekly Comment
***************************************
In my world, here’s what tells the story of the week: EDZ’21/EDZ’22 calendar spread rose 13.5 bps on the week from 38 to 51.5. EDZ’22/EDZ’23 was nearly unchanged, rising just 0.5 from 68.5 to 69.0. EDZ’23/EDZ’24 fell 12.5 bps from 43.5 to 31.0.
In layman’s terms, the market moved the odds of a near term hike aggressively closer. Flattening of the curve from the end of 2023 forward suggests that the market is forecasting slower growth in the future. It’s not at all clear whether that’s a correct projection; obviously there are huge positions on the ED curve that get forced out without the luxury of thinking through all of the forward economic scenarios. What is absolutely certain though, is that sentiment for the idea that the Fed will have to move up hikes to deal with inflation and shortages has taken hold.
In the month before the June FOMC, EDZ’21/EDZ’22 spread was 18 to 21 bps, timidly pricing the chance of one hike by the end of next year. Now it is 51.5 and Jan’22/Jan’23 FF spread is 45.0, both new highs for the year. So now it’s more like 2 hikes. That doesn’t sound particularly earth-shattering. However, it’s worth noting that EDM’22, which was sold in size over 100k at 99.78 on Friday October 8, ended this past week at 99.68, without the libor setting having changed at all.
Some might be tempted to call this the return of the ‘taper tantrum’, justifying former NY Fed President Dudley’s warnings from the start of the year that the Fed would not be able to avoid such an outcome. In January he said, “Unfortunately, there’s little the Fed can do to prevent another taper tantrum. The best it can do is be prepared and communicate clearly and consistently.” By August he said a tantrum was less of a risk, because of the Fed setting the table appropriately. We’ve had a front-end sell-off for sure, but it is not in the category of a tantrum.
The chart below covers the period from April to October of 2013, when the actual taper tantrum occurred. The FF target was 0-0.25 as it is now. Keep in mind that the actual first hike did not occur until December of 2015. In other words, long liquidation of front contracts at that time was ultimately unwarranted. On the chart, I use ED6 which is the rolling sixth quarterly. The actual contract that printed a low of 9908.5 was EDZ’14. On Friday, the sixth quarterly, which is the second red, traded to 9912.5. Using this sort of analysis, one might judge that the short end is perhaps out over the skis. That is to say, that the first few reds have more or less tracked the tantrum and that long positions from these levels (or a little bit lower) have good risk/reward prospects.

However, there are important differences between than and now. In 2013, CPI was bouncing around 1 to 2% on a yoy basis. Last week’s CPI print was 5.4%, the highest since 2008 when oil hit $140/bbl. There are widespread reports of bottlenecks and shortages globally. When one problem gets better, another crops up. In 2013, unemployment was 7.7% average in Q1, 7.55% in Q2 and down to 6.7% by year-end. It’s now 4.8%. Macroeconomic variables much more easily justify rate hikes now as compared to the earlier period.
This is from Cass Transportation Report
Bottlenecks in the ports and elsewhere caused the number of freight shipments to decline from August to September by nearly 5%.
This supply & demand dynamic we’re witnessing- along with the cost of fuel and other factors- has caused the average cost of a shipment (not the same as rates) to spike to a +31.4% y/y change.
There’s much to read this month, including the new inflationary risks that may drive costs even higher.
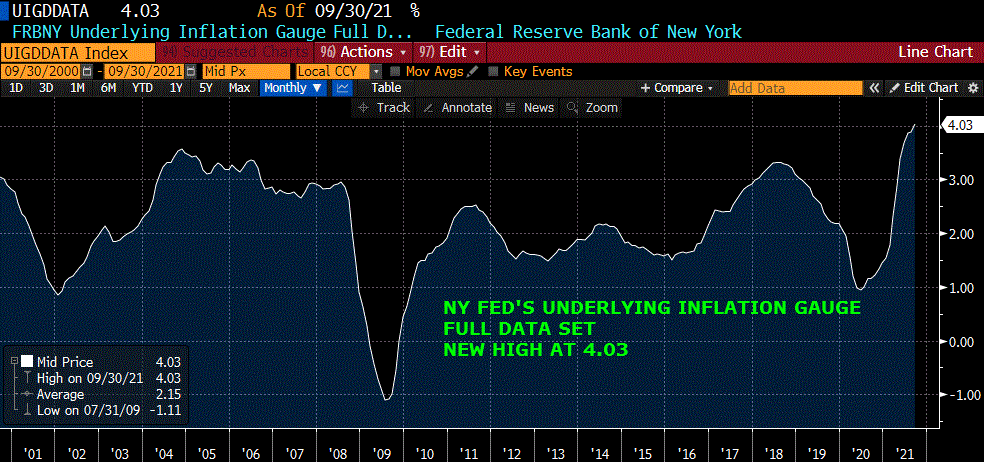
We know there’s inflation. The NY Fed’s Underlying Inflation Gauge hit 4.03, a new high (chart below). We know bottlenecks are actually holding down growth. The question is the Fed’s response. It’s clear that extraordinary stimulus from the Fed and the Fed’l government was in part responsible for the inflation we are seeing now. It’s almost amazing that the Fed takes credit for saving the economy but then can’t quite grasp that they’ve overdone it and need to reverse. Even the Fed’s primary emphasis on jobs can make the case for rate hikes, with a hint coming from reference to the Kansas City Fed’s Labor Market Conditions index in the FOMC minutes. (chart below). That index has matched pre-covid levels. The market is pushing for hikes, sooner rather than later.
Below is KC Fed’s Labor Mkt Conditions

The first three one-year Eurodollar calendar spreads are EDZ’21/Z’22 at 51.5, EDH’22/H’23 at 67.0 and EDM’22/M’23 at 73.5. All new highs for the year. From the ED6 taper comparison, one might ponder whether these spreads should be sold. Said another way, is a contract like EDM’23 too low at 9894.5? That’s a yield of 1.055%, with CPI 5.4%. Let’s leave that question for a minute, and look a bit further back. At the start of this note, I also mentioned EDZ’23/EDZ’24 which FELL 12.5 to just 31 bps. While it may or may not be the case that front spreads overshot the upside, it seems to me that back spreads are getting quite cheap. EDH’24/EDH’25 settled at 26, the lowest settle of the year in that spread. The green pack (3rd year, EDZ3, H4, M4, U4) to the blue pack (4th year, EDZ4, H5, M5, U5) settled just above 24 bps. In 2013’s taper tantrum, the green/blue pack spread doubled in two months, from 55 in the beginning of May to 109 by July 5. The five-year note, which ended Friday at 1.122%, in 2013 went from 70 bps in May to 1.61% at the start of June and eventually topped at 1.85% in the beginning of Sept.
In my opinion, a tantrum now is actually justified. I take the Fed at its word that rate hikes will be relatively restrained, but I think a hiking schedule of 50 to 75 bps per year is too modest, given the starting point. Steepening in front while flattening in back projects the idea that near term rate hikes will slow an already vulnerable economy and quell inflation. The former might be true, but the latter not.
“This fall I think you’re riding for—it’s a special kind of fall, a horrible kind. The man falling isn’t permitted to feel or hear himself hit bottom. He just keeps falling and falling. The whole arrangement’s designed for men who, at some time or other in their lives, were looking for something their own environment couldn’t supply them with. Or they thought their own environment couldn’t supply them with. So they gave up looking. They gave it up before they ever really even got started.”
JD Salinger, Catcher in the Rye.
They were looking for inflation!
| 10/8/2021 | 10/15/2021 | chg | ||
| UST 2Y | 31.6 | 39.9 | 8.3 | |
| UST 5Y | 104.7 | 112.2 | 7.5 | |
| UST 10Y | 160.3 | 157.6 | -2.7 | |
| UST 30Y | 216.2 | 204.8 | -11.4 | |
| GERM 2Y | -69.1 | -67.7 | 1.4 | |
| GERM 10Y | -15.1 | -16.7 | -1.6 | |
| JPN 30Y | 69.2 | 68.7 | -0.5 | |
| CHINA 10Y | 290.4 | 3.0 | -287.4 | |
| EURO$ Z1/Z2 | 38.0 | 51.5 | 13.5 | |
| EURO$ Z2/Z3 | 68.5 | 69.0 | 0.5 | |
| EURO$ Z3/Z4 | 43.5 | 31.0 | -12.5 | |
| EUR | 115.77 | 115.99 | 0.22 | |
| CRUDE (active) | 78.76 | 81.73 | 2.97 | |
| SPX | 4391.34 | 4471.37 | 80.03 | 1.8% |
| VIX | 18.77 | 16.30 | -2.47 | |
https://www.bloomberg.com/opinion/articles/2021-01-21/the-fed-will-trigger-another-taper-tantrum
https://blinks.bloomberg.com/news/stories/R0ZB0AT0G1KZ
Capitulation
October 15, 2021
–Eurodollar curve continued to flatten even as stocks soared on earnings. New recent lows in pack spreads: red/green at 54.625 (holding above 1/2% but down 2.125 on the day). Red/gold 96.875, down 1.625 on the day. There was massive futures liquidation with open interest plunging 220k, almost all in the first two years. The only two contracts on the ED curve that didn’t close positive on the day, EDM’22 and EDU’22 (which were both unchanged) had the largest drops in OI, down 63k and down 84k. This suggests to me that longs finally capitulated. At a price of 9858.0, EDU2 is 29 bps over the current libor setting, so one hike is priced. Note that on Sept 21, the day before the FOMC, EDU2 settled 9972.5, so this morning’s print of 57.5 is exactly 15 bps lower. If taper is over mid-year, then a hike comes in Q3. Summers is practically cheerleading with a megaphone, chastising the Fed for being behind the curve and losing sight of the core mission.
–Commodities continue to trade higher, from A to Z, with aluminum and zinc getting headlines on new highs. IKEA warned of continued supply shortages. Retail Sales are released today, expected -0.2 but +0.5 ex-autos. If shortages are impeding sales, does that mean interest rates should be going lower?
–Midcurve option expiration today for October. EDZ’24 settled exactly on strike at 9837.5. The Blue Oct (3EV) 9837.5 straddle settled 4.5. This morning’s low print in the contract is 9832.5….that straddle was a little too cheap. Worth noting that there has been heavy long liquidation of 0EZ 9937.5 puts and 9937.5/9912.5 p spreads, but that there was some new put buying on blues. 3EZ 9837.5/9800p spd settled 10.25, 11 was paid in 30k. Also a new buyer of 8k 3EG (Feb) 9800/9762p 2×3 to open those strikes. Settled 3 and 1.
–The back end rally has likely run out of steam. If front eurodollars are truly an indication of capitulation, it may not be too much of a stretch to think it has occurred throughout the curve, in other words, the rally on long treasuries was, in a way, forced, and that back end yields can resume a higher path.
That’s what this starship is all about
October 14, 2021
“Risk is our business! That’s what this starship is all about. It’s why we’re aboard her!”-Captain Kirk
–There was some risk evident on the USS Eurodollar curve yesterday. It was as if Starfleet Command had announced a rate hike that would put a stake in the heart of forward economic growth prospects. The curve flattened pretty massively. Reds (2nd year forward) were DOWN 5.125 bps and Golds (5th year) were UP 5.375. A move of 10.5 bps in this spread is unusual, especially when prices move in opposite directions. EDZ’24 was the pivot, closing at 9932.0 up just 0.5 on the day. Front one-year eurodollar calendars made new highs; the peak is still EDU’22/EDU’23 which posted a new high settle of any 1-yr for this year at 80.5. Blues to golds (4th to 5th year contracts) made new recent lows. As an example, EDU’23/EDU’24 closed at 38 less than half of the spread the year before. EDZ’22 traded as low as 9933 yesterday, fully 25 bps below where it was on Sept 21, the day prior to the last FOMC. EDZ2 settle of 9937 is consistent with the idea of nearly two hikes by the end of next year.
–This occurred against a backdrop of 5.4% CPI, the annualized high since the peak in 2008 of 5.6%. On a related note, the Social Security Admin has this note posted on the website: “Social Security and SSI benefits for approximately 70 million Americans will increase 5.9% in 2022.” On my antenna TV, Amazon, McDonalds and FourWinds Casinos are constantly running ads for workers, highlighting strong wages and benefits.
–In treasuries, the two year yield was up 2 bps and thirties fell 6.2 to 2.045%. 5/30 ended at 96, the low of this year, but only about halfway back from the mid 2018 low of 19 to the Q1 high of this year of 163. 50% is 91. The aforementioned red/gold pack spread at 98.5 is similarly close to the halfway back point of 2018 low (-6) to 2021 high (182) around 94.
–From the IMF Global summary yesterday, there’s this edict:
“Central banks will need to provide clear guidance about their future approach to monetary policy, aiming to avoid an unwarranted or abrupt tightening of financial conditions. Monetary authorities should remain vigilant, and if price pressures turn out to be more persistent than anticipated, act decisively to avoid an unmooring of inflation expectations. Fiscal support can appropriately shift toward more targeted measures and be tailored to country-specific characteristics.”
–Obviously, the CBs are not being particularly vigilant, inflation expectations seem to be coming unmoored, and the market is close to taking matters into its own hands. The Fed appears to be boxed in. Crude oil this morning near a new high with CLX1 trading up 95 cents at 81.39. China’s Factory gate inflation “rose to a record on soaring commodity prices, but weak demand capped consumer inflation…” (RTRS). China PPI was +10.7%. US PPI on tap for today expected +8.7% with Core +7.1%.
CPI, 30y, Minutes
October 13, 2021
–Today brings CPI, expected 5.3 yoy, with Core 4.0, both unchanged from last month. Thirty year bond auction. FOMC minutes after that. The IMF slightly downgraded global growth. “The outlook for the low-income developing country group has darkened considerably due to worsening pandemic dynamics. The downgrade also reflects more difficult near-term prospects for the advanced economy group, in part due to supply disruptions.”
–A few interesting notes from yesterday: EDU’22/EDU’23 which is the peak one-yr calendar spread on the curve, settled 77 yesterday. The highest that any one-yr has settled in 2021 has been 78 on April 5, the 9th to 13th quarterly, or first green to first blue. At the time it was EDM’23/EDM’24. That particular spread is now 60.5; the peak spread has now moved forward to the 4th/8th or last white to last red. Of course, this latter spread encompasses libor transition, but the steepness has moved closer in time as (global) tightening expectations are brought forward. The attached chart shows Dec’22 contracts in Short Sterling, Canada BAs, Euro$ and Euribor. Since the start of September, declines have been 56 bps, 39.5, 18 and 13. I suppose it makes sense that the US curve would flatten given weakness in reds and greens, but the rally in back contracts yesterday was aggressive given inflationary concerns. Reds -1.75, Greens -0.125, Blues +2.875 and golds +5.5.

–While EDZ2 closed -1.5 at 9940.5, there was large liquidation of options, starting with sales on 0EZ 9937.5 puts at 4 ref 9941.5/42. Settled 5.0. New recent high in EDZ1/EDZ2 at 42 (+1). In Fed Funds, Jan’22/Jan’23 settled 36, forecasting 1.5 rate hikes over next year.
–Recently there have been some large one-day sell-offs in gold. Every time it starts to rally with other commodities, it’s beaten back. This morning GCZ1 is again trying to rally, trading at 1770. There are several lows in October at 1750 or just below. I think sellers will be absent on the next upward surge, which appears imminent.

