
Fear? That’s the other guy’s problem
January 29, 2021
–On Tuesday I wrote this in my missive “There is likely intense lobbying of the Fed to institute some macroprudential tools in the quest to save markets, under the guise of saving Robinhood traders from themselves, when in reality it’s some of the professionals that are close to being carried out. But the latter group owns the lobbying machinery.” They didn’t get to Powell, who averted his gaze while saying “think of the unemployed.” They did though, get to the brokerage houses, which are now tripping all over themselves trying to reverse trading restrictions that have alienated their customer base. In the dotcom run up, Greenspan acknowledged that there would be inevitable fall out. But he said he didn’t think it was the Fed’s job to interfere in the decisions of millions of individual investors.
–Are these new investors not a major component of the entire bull run? Maybe they decide en masse that yes, the game IS rigged and it’s better to just go back to sports betting. Portnoy is advising followers to HOLD. Admirable in a way. But compare that to the famous short seller Carson Block of Muddy Waters. He cut his positions on the realization that the reddit crowd is targeting short sellers, saying “there are no medals for valor in this business.” It’s a tactical decision: though his positions might be ‘right’ he’ll sit this dangerous dance out. With an avalanche of zealous new regulations coming in, maybe a lot more investors take to the sidelines.
–Rates rose yesterday as stocks staged a recovery, with tens up 4.2 bps to 105.3. A few large trades re-focused attention on the downside. An exit seller of 30k TYH 138c at 10. Buyer of 30k TYJ 137/136p 1×2 for 4/64 and 3/64 credit covered 136-165, and a later buyer of 20k TYJ 136/135p 1×2 flat vs 136-055. Currently the 1x2s have call deltas, but open interest is quickly starting to build in April options.
–It’s not always a friendly business. As Louis Winthorpe III said to Billy Ray Valentine, “Fear? That’s the other guy’s problem. Nothing you have ever experienced will prepare you for the absolute carnage you ae about to witness. Super Bowl, World Series – they don’t know what pressure is. In this building, it’s either kill or be killed. You make no friends in the pits and you take no prisoners. One minute you’re up half a million in soybeans and next, boom, your kids don’t go to college and they’ve repossessed your Bentley. Are you with me?”
The Fed defers
January 28, 2021
–SPX and Nasdaq fell 2.6% yesterday. The ten year yield fell 2.7 bps to 1.011%. GME surged 134% with a market cap of around $10 billion. BedBath and Beyond BBBY was up 43% with a market cap of $4.5b, Target TGT fell 5% with a cap of $94b.
–In 2000 Nasdaq was near 5000, by 2002 it had lost 80% of its value.
–Powell dismissed the Fed’s responsibility for speculation, but on a question regarding discrimination, he was able to make the leap that it IS part of the Fed’s umbrella in that we want all able-bodied working Americans to be able to find jobs to fulfill the mandate of full employment and maximum output. The logical connection is that the Fed will look past financial stability if it means that people are put to work. Speaking of ‘looking past’, Powell deemed both housing strength and upcoming inflation increases as probably transitory.
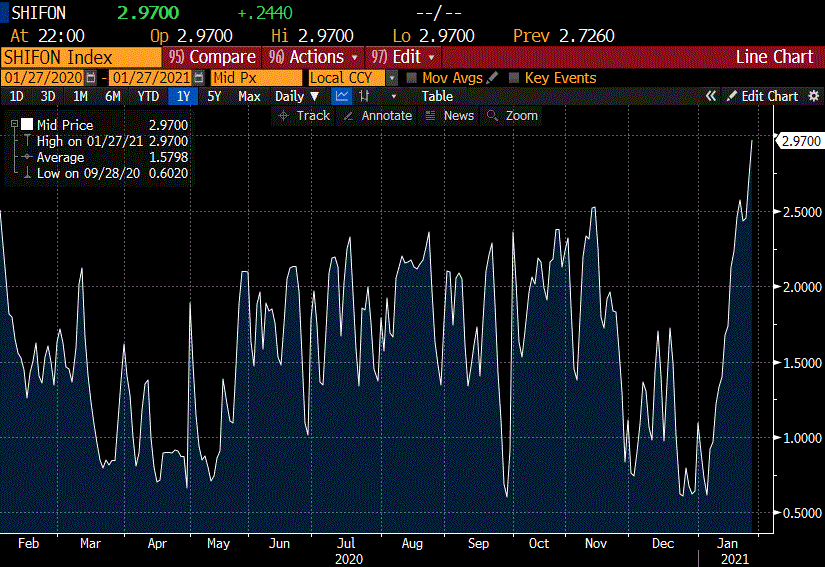
–Compare this to a blurb on Zerohedge that a Chinese official said the PBOC is restraining liquidity to combat surges in property and stocks. I have attached a chart of o/n Shibor, from 60 bps in early January to 300 bps now.
https://www.zerohedge.com/markets/meanwhile-china-giant-liquidity-shortage-pushes-overnight-rates-5-year-high
–VIX popped up to 36, interest rate vol was moderately stronger as well. The curve flattened a couple of bps, but Powell’s comments support a steeper curve in my opinion. A persistent theme in rates has been selling of calls and buying puts or put spreads. Yesterday TYJ 138/133.5 risk reversal bought early, settled 5 for the call vs TYM1 at 136-17. The 138 strike is around 85 bp yield.
–News today includes Jobless Claims expected 875k vs 900. Q4 GDP 4.2%. New Home Sales.
Not my circus, not my monkeys
January 27, 2021
–FOMC today. Questions relating to a “financial stability” mandate and macro-prudential tools are likely to pepper the press conference given GME and other stock market acrobatics. Until now, the Fed has gone with the ‘Not my circus…’ line of defense. I sort of doubt that IOER will be tweaked, but the Fed Effective rate was 9 bps all of January until the 21st, when it dropped to 8 and remained there, so there’s been slight deviation from the target midpoint. Fed Fund contracts from February out to June 2022 settled 9993 to 9992.5.
–Not much change in rates yesterday, tens edged slightly lower in yield to 1.038%. In dollars, a seller of 20k EDU1 9981.25/9975 put spread at 1.5, appears to be new shorts in the top strike. Settled 1.5 vs EDU1 9982.0. Buyer of 20k 3EH 9912/9900 put spread for 1, settled there ref EDH4 at 9934. Decent new buying in TYH 138c which settled 11 vs 137-12. 7-year auction today. Durables this morning expected +1.0%.
–Solid results from MSFT yesterday post-close. Today AAPL, FB and TSLA report. With the latter near $900, a good report might be the opportune time for Nancy Pelosi to pitch the March 500 calls she picked up on TSLA in December. We’re all under the big top now.
Gamers
Jan 26, 2021
–Somehow seems appropriate that the stock garnering all the attention is called Gamestop. The capital infusion by Citadel and Point72 of $2.75 billion into Melvin Capital (who apparently suffered large losses from GME shorts) is a signal that this game might just about be over. There is likely intense lobbying of the Fed to institute some macroprudential tools in the quest to save markets, under the guise of saving Robinhood traders from themselves, when in reality it’s some of the professionals that are close to being carried out. But the latter group owns the lobbying machinery. By the way, according to Bloomberg, the available float on GME is 50.2 million shares. Volume yesterday was 3.5 times that at 177 million!
–ZH has an article showing put positions on some of the most shorted stocks. GME’s move was breathtaking, a range of 61 to 159 yesterday. Late in the day I looked at Feb 19th 77 puts with the stock trading about 77. They were around 30, a breakeven of 47; it would take a decline of nearly 40% to break even. Blackberry’s Feb 18 puts, with stock 18.03, were 5.40, or about 30% lower b/e.
–There appeared to be rebalancing trades occurring yesterday. SPX has gained about 2.6% so far in Jan, while the ten year yield rose from 91.6 on Dec 31 to 1.038 as of yesterday. So modest selling of stocks and buying of bonds shouldn’t be all that surprising going into month end. Yesterday tens fell 5 bps, having closed Friday at 1.087%. Curve flattened with 2/10 falling 4.5 bps to 91.9.
–Five year auction today. MSFT and AMD report are the close.
From Reminiscences. Relief plan…
Then, before half past two in the afternoon, J. P. Morgan sent John T. Atterbury, of Van Emburgh & Atterbury, who was known to have close relations with J. P. Morgan & Co., into the money crowd. My friend said that the old broker walked quickly to the Money Post. He raised his hand like an exhorter at a revival meeting. The crowd, that at first had been calmed down somewhat by President Thomas’ announcement, was beginning to fear that the relief plans had miscarried and the worst was still to come. But when they looked at Mr. Atterbury’s face and saw him raise his hand they promptly petrified themselves. In the dead silence that followed, Mr. Atterbury said, “I am authorized to lend ten million dollars.
Take it easy! There will be enough for everybody!”
Big earnings week
January 25, 2021
–Ten year futures pinned the 137 strike on Friday’s Feb option expiration as TYH settled 137-01, with a corresponding cash yield of 1.087% down 2 bps on the day. Although this week features the FOMC on Wednesday, and treasury auctions of 2, 5 and 7 year notes beginning today, earnings reports from tech giants may overshadow other news. MSFT and AMD on Tuesday, AAPL, FB and TSLA on Wednesday. Core PCE prices released on Friday (Fed’s preferred inflation measure).
–Continued buying of 3EU1 9862.5p for 5.0…accumulation of 50k last week. Treasury vol remains muted; we’ll probably see some replacement buying of wings in April this week as Feb expired.
–Libor transition announcement on its way. At 5pm London today, “the benchmark’s administrator will stop accepting feedback on its plan to extinguish the rate, setting the stage for an announcement, possibly within days…” (link below)
–Interesting La Nina link also attached. The article attributes part of the rise in soybean prices to negative effects of La Nina in Argentina.
https://blinks.bloomberg.com/news/stories/QNDVXIT0AFB4
https://blinks.bloomberg.com/news/stories/QN8GGSDWLU6G
I’ll get you on the back end
January 24, 2021 -Weekly comment
This note is Eurodollar specific (which ought to whittle down the audience). I was having a conversation with former pit trader/spreader, who is shorting a red/green/blue one-year butterfly, reasoning that the nearer one-year spread is constrained by the Fed holding rates near zero for some time, while the back spread will react to the prospect of post-covid growth and a rise in inflation by widening. I started to think a lot more this week about one-year Eurodollar calendars and where I have seen them trade.
I created the chart below using just two constant-maturity one-year calendars. The white line is the 2nd quarterly contract versus the 6th, (white/red). The green line is the 9th to 13th. (green/blue). I noted this week that green/blue is currently the peak area of steepness on the curve; on Friday EDH1/EDH2 settled 0 (white/red), EDH2/EDH3 settled 10.5 (red/green), EDH3/EDH4 at 40.0 (green/blue) and EDH4/EDH5 (blue/gold) at 35.5. I ran a lot of charts from 1991 until present, but roughly distilled my findings into this single graph, otherwise it’s just a jumble of lines.

The peak one-year level I have ever seen was at the end of 2001, 262.5 bps. This was the Nasdaq bubble fallout, when the Fed slashed rates from 6.5% in Dec 2000 to 1.75% by Dec 2001. At the end of 2007, the all-time low 1-yr calendar level was negative 158 bps. That was the 1st contract to the 5th; the chart I created shows a minimum of negative 95 (at the same time) for the 2nd to 6th. This nadir followed the Fed’s “hike-every-single-meeting” campaign from summer of 2004, starting from 1%, to June 2006, ending at 5.25%. The Fed left FF’s there until September of 2007; near spreads cried uncle by seriously inverting.
What I find interesting about the chart concerns the level of green/blue, represented by the 9th to 13th contract spread. Over the past thirty years, it has been roughly bounded by around -5 to +120 bps. The high in 2003 was 119. In 2009 it briefly spiked to 126. There are a series of other highs from 2009 and 2012 between 100 and 110. Even though it is not the actual max value, I circled the Q3 2013 level of 122.5, as that was the outcome of the taper tantrum, which has taken a bit of added significance this week due to Dudley’s ramblings, of which I have included the following snippet:
However, later this year, as vaccination helps get the virus under control and the economy rebounds, Fed officials will become more confident that they will need to start tapering in early 2022. As this comes into clearer focus, the Fed’s communication about tapering will necessarily change to foreshadow this shift, and that will generate the inevitable tantrum.
These spreads sort of beg the question, “Were the calendars correctly forecasting the future?” Or were positions all just leaning one way only to be capsized as everyone ran to the other side of the boat like the 1915 SS Eastland disaster on the Chicago River?* Obviously, the surge in the curve in 2013 was incorrect. The 9th to 13th spread would have been EDU’15/EDU’16, and the first hike was in Dec 2015 followed by the next 25 bp increase in 2016. In hindsight, a spread of 122 was too high.
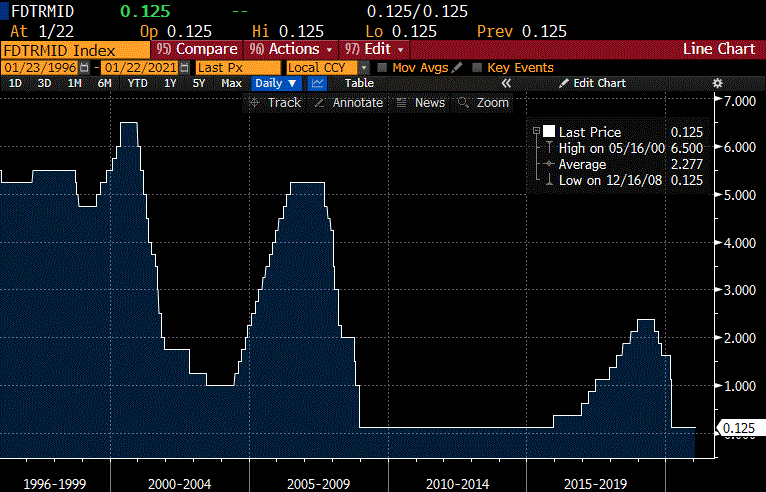
Dudley’s argument is that the Fed has lured complacency into fixed income markets. Powell himself made what I thought was sort of a reckless remark about servicing debt, saying that while debt levels are high, servicing costs remain more than manageable because rates are so low. Yellen explicitly said the same thing, “The world has changed. In a very low interest-rate environment like we’re in, what we’re seeing is that even though the amount of debt relative to the economy has gone up, the interest burden hasn’t.” The implication is that rates will stay low forever. (FF chart below)
Clearly, when considering one-year calendars, there is asymmetric behavior. When the Fed is slashing rates from relatively high levels, calendars can explode as front contracts plummet much faster than deferred. However, in a tightening regime, the market perceives a limited pace. The 2004 to 2006 cycle featured a 25 bp hike at every meeting, a total of 200 per year given eight meetings. At the beginning of the effort, the 2nd/6th had it about right, as the spread in Q204 peaked at 193. From there, spreads actually compressed, underpricing the Fed’s resolve. The last time there was a hike of 50 bps was May 2000 with a move to 6.5%, the final straw for Nasdaq.
My question is whether the market might have a ‘tantrum’ prior to any Fed signals, specifically with respect to back spreads. The max one-yr spread on the curve is currently EDM’23/EDM’24 at 42. Seems high, but remember, green/blue maxes at around 120.
At Powell’s recent Princeton interview, he notably mentioned the reserve status of the US dollar several times (is he secretly harboring some concerns?). Reserve status is clearly a factor which allows rates to stay low. However, the quest for inflation coupled with increasing deficits has led some to voice concerns about interest payments on the debt overwhelming all other spending categories. In this case, would belated rate increases by the Fed underpin the dollar? Or would it have the opposite effect due to the exacerbation of budget deterioration, thus causing reinforcing steepening on the back end of the curve? Does this line of thought filter into crypto-ccy demand?
My conclusion is that back spreads are likely still too low, even though they’re currently at the top of the recent range. That idea squares with recent buying of blue midcurve puts, for example the purchase last week of 50k 3EU1 9862.5p for 5.0. Giving free rein to imagination, I can envision scenarios where even 120 bps fails to cap back spreads. I am not saying the odds are high, in fact they are likely quite low. But consider an utter breakdown of fiscal discipline coupled with Fed accommodation. The dollar would continue to decline, and if even remotely plausible, a spillover into equity market selling would further aggravate budget problems. In such a low probability event, back spreads could surprise to the upside.
______________________________________________________________________________
*The SS Eastland disaster
On July 24,1915 employees of Western Electric Company were heading to an annual picnic. About 7,300 people arrived at 6 a.m. at the dock between LaSalle and Clark streets to be carried out to the site by five steamers. While bands played, much of the crowd—perhaps even more than the 2,500 people allowed—boarded the Eastland. Some reports indicate that the crowd may also have all gathered on one side of the boat to pose for a photographer, thus creating an imbalance on the boat. In any case, engineer Joseph Erikson opened one of the ballast tanks, which holds water within the boat and stabilizes the ship, and the Eastland began tipping precariously.
More than 800 people perished in this accident.
OTHER MARKET THOUGHTS/ TRADES
The EDU3 9950c settled 19.75 on Friday, up 1.25 on the day and 1.75 on the week, with futures up from 9947.5 to 9948.0. As selling has abated (one player short ~115k), vol floats up.
As noted last week there’s a possibility of a SOFR/libor spread announcement this week regarding the fix.
TYH1 pinned the 137 strike going into the Feb option expiration on Friday. I had mentioned buying USH put spreads last week, but the contract never made it above the 170 strike, which is where I would have liked to set shorts. Currently consolidating between 169-08 and 169-08.
FOMC on Wednesday. Treasury auctions of 2, 5 and 7 year notes this week in size of $60, $61 and $62 billion! PCE Core yoy prices on Friday expected 1.2%.
With respect to prices, note that Philly Fed’s price index last week surged to 45.4, highest since 2018 (when the peak had been 60.8). Markit flash Mfg PMI was released Friday at 59.1, highest since May 2007. From Reuters: “…the pandemic is gumming up the supply chain, resulting in manufacturers paying more for materials, and they are passing on the higher production costs to consumers. The survey’s gauge of prices received by factories vaulted to its highest level since July 2008.”
| 1/15/2021 | 1/22/2021 | chg | ||
| UST 2Y | 13.5 | 12.3 | -1.2 | |
| UST 5Y | 45.3 | 43.3 | -2.0 | |
| UST 10Y | 109.5 | 108.7 | -0.8 | |
| UST 30Y | 185.2 | 185.6 | 0.4 | |
| GERM 2Y | -72.0 | -70.7 | 1.3 | |
| GERM 10Y | -54.3 | -51.2 | 3.1 | |
| JPN 30Y | 64.3 | 64.9 | 0.6 | |
| CHINA 10Y | 314.8 | 312.6 | -2.2 | |
| EURO$ H1/H2 | 1.0 | 0.0 | -1.0 | |
| EURO$ H2/H3 | 10.5 | 10.5 | 0.0 | |
| EURO$ H3/H4 | 39.0 | 40.0 | 1.0 | |
| EUR | 120.80 | 121.75 | 0.95 | |
| CRUDE (active) | 52.42 | 52.27 | -0.15 | |
| SPX | 3768.25 | 3841.47 | 73.22 | 1.9% |
| VIX | 24.34 | 21.91 | -2.43 | |
Kinky Curve
January 22, 2021
–A few new highs yesterday: Ten year treasury to inflation-indexed note breakeven to 218.5. There are a lot of data points that can’t quite seem to surpass highs from the middle of 2018, but this spread has equaled the highs of that year (10 yr inflation proxy). 5/30 treasury sprd new high at 143 bps. Interestingly, 5/30 was at a new LOW in mid-2018 at just 21 bps. Today’s level is the highest since Trump’s election in 2016 when it reached 140.
–Green/blue euro$ pack spread (3rd year forward to 4th year forward) has been an outperformer, settling at 38.25. This is the highest since 2015 (chart attached). Strength here is due to several factors: 1) general steepening 2) Fed guidance of no hikes for three years 3) the libor extension announcement until June 2023. EDM3/EDU3 spread on its own is 16.5; it had been 5 in late November just prior to the announcement. From BBG, “ICE Benchmark Admin’s latest consultation concludes Jan 25, and some strategists have speculated an announcement on when the spread [SOFR/libor] will be fixed – and thus apply to the new secured overnight financing rate benchmark – may come as soon as next week. This spread will be the pricing gauge for euro$ futures after June 2023.” Such an announcement could cause further steepening of grn/blue.
–The red/green (2nd to 3rd year) spread is just 23 bps, while blue/gold (4th to 5th) is 34, so green/blue is obviously where the meat is. Consider that the 2/10 treasury spread closed 98.4, and red/gold euro$ pack spread at 95.25, essentially equal. So this one-year kink in the curve is worth about 40% of the steepness in 2/10…

–In a more general comment about the curve and inflation dynamic, here’s a tweet from Michael Ashton, @inflationguy : “I know that money doesn’t matter (tongue in cheek), but last week M2 rose almost $400mm, to bring the 52-week rise to 27.1%. Now, volatility around year-end is normal but…no sign the Fed is slowing.”
–There’s a lot of coverage concerning bitcoin’s 20% + fall from grace over the past 5 sessions (more like 33% from absolute high to this morning’s low). Bitcoin has been a poster child for rampant speculation, even though the recent entrance of new institutional players has now provided the cover of legitimacy. Nasdaq’s seeing a bit of profit taking this morning after new highs, could some of the speculative froth be skimmed away here as well?
Playing the lottery
January 21, 2021
–Equities surged to new highs on Biden’s inauguration, but fixed income maintains an underlying bid. Tens essentially unchanged at 1.09%. Eurodollar curve out to five years unch’d to -1. However, even though overall action was muted, EDH1/EDH2 one-year eurodollar calendar settled at a new recent low of -0.5 due to a seller of about 40k (9981.0/9981.5). This is the only inverted one-year calendar on the strip, and hasn’t been negative since late September. Forward one-year spreads are increasingly positive as ‘normalization’ is expected. EDH2/EDH3 settled 10.5 and EDH3/EDH4 at 39.0. These forward spreads give an indication of when the market thinks the Fed will actually be tightening, though there have been a smattering of option put spread trades on 2022 and early 2023 contracts just in case the timetable is moved up.
–ECB today. Stocks continue to levitate this morning, though the Russell is slightly underwater as of this writing.
–Implied vol in treasuries remains blanketed. With 30 days until expiration TYH 137 straddle settled 58/64’s just 2.9%. Feb options expire tomorrow with the contract hugging the 137 strike (136-31 settle). Peak open interest in Feb TY puts is at the 137 strike with 149k open. Those puts settled 8; longs have little chance left to monetize them and shorts have every incentive to defend their position by supporting the contract. Asset manager buying of OTM April puts should commence today or next week as Feb expires; something like TYJ 130 puts for 1 (settled 2 yesterday).
–In the administration’s first new initiative for wealth redistribution, the mega-millions lottery is up to $970 million for tomorrow’s draw. It’s not as if a payout like that comes with the same satisfaction associated with the hard work of buying out of the money calls on the next soaring microcap, but it’s a start.
Hump day
January 20, 2021
–Inauguration day. Treasury auctions 20y bonds. Fed’s purchases tomorrow consist of $3.625 billion in 7 to 20 yrs.
–Although Mnuchin, with input from TBAC, ultimately dismissed the idea of issuing long dated bonds, former Treasury Sec’y Robert Rubin last week suggested locking in long-term borrowing costs with long dated issuance, and Yellen said in yesterday’s testimony she would be glad to study the idea. No discernable market impact as tens closed at 109.2 and the thirty-yr bond fell 1.3 bps to 1.84%.
–Yesterday’s flow in dollars mostly consisted of buying low delta put spreads, the largest of which was 40k 2EU 9937/9925/9912/9900 put condor for 2.5 vs various futures levels. Settled 2.25 vs EDU23 at 9948.5. Also a couple of long dated red put spreads, +20k EDH2 9975/9962ps for 1.75 and +15k EDM2 9975/9962ps for 2.5.
–Feb treasury options expire Friday. TYG 137 straddle settled 22 vs 136-30. TYH ^ settled at exactly 1’00 with 31 dte. There had not been much migration into April options, but it started to trickle in yesterday with TYJ put open interest adding 35k bringing the total to 78k. April call open interest is just 17k.
–NY Fed business leaders survey (regional) out yesterday, showing a wide disparity between worsening current conditions and expected future improvement. A couple of interesting quotes regarding prices: “Employment levels declined at a faster clip though wage increases picked up. Both input prices and selling prices increased at a faster pace than December.”
Yellen sellin’
January 19, 2021
–Once again worth noting the large seller of EDU’23 9950 calls which has smothered back month eurodollar vol and spilled slightly over into treasuries. On Friday another 40k were sold at 17.5, bringing the total to ~115k. Settled 18.0 vs 9947.5. Yesterday’s holiday activity appeared muted. Tens ended Friday at 1.095% ref TYH1 136-275. Futures currently 136-23 with stock index futures rallying into the start of earnings season.
–Today Yellen appears before the Senate to sell the new administration’s stimulus package. From the relatively friendly seat at the Fed to a more charged environment. The challenges will become greater in Q2 as official inflation figures are expected to firm significantly due to baseline effects. Price increases across commodity markets are plainly visible. The FT is leading with this headline: “Tripling of China-Europe shipping costs threatens goods supply”. On the other hand, Lacy Hunt’s Hoisington Review maintains a bullish stance on treasuries. “When debt capital, like any other factor of production, is overused its marginal revenue product declines. This serves as a persistent drag on economic activity that restrains growth despite the best efforts of monetary and fiscal policy.” In previous missives he cautioned that overt Fed monetization of huge federal deficits would cause him to re-evaluate his call for ever lower yields. That warning was absent this time.
–Is inflation dependent on growth? I think not. It’s more of a sentiment change: Hoarding, (and paying more) to ensure supplies that were previously taken for granted. The last link in the supply chain has seen prices compress as displaced workers were forced into the food and consumer goods delivery gig by Covid. The links in front of final delivery are likely getting stickier. We’re moving into a different regulatory environment, and, (I’ll provide the warning that Hunt omitted) a central bank that has abandoned inflation concerns and elevated labor disparity as a top policy objective, while monetizing debt.

