
Russell vs SPX
January 18, 2021
–As noted previously, NFIB small business optimism seems to be correlated with Russell 2000 small cap index. When Trump was elected, the combination of less regulation and lower taxes sparked a surge in NFIB, and Russell soon followed. The two are diverging currently, with small business optimism plunging in the last report to 95.9, a level which is below the average of the index dating back to 1973, and Russell soaring to new highs, having more than doubled off the March low.
From the report:
“This month’s drop in small business optimism is historically very large and most of the decline was due to the outlook of sales and business conditions in 2021. …Small businesses are concerned about potential new economic policy in the new administration and the increased spread of Covid-19 that is causing renewed government mandated business closures across the nation.”
https://www.nfib.com/surveys/small-business-economic-trends/
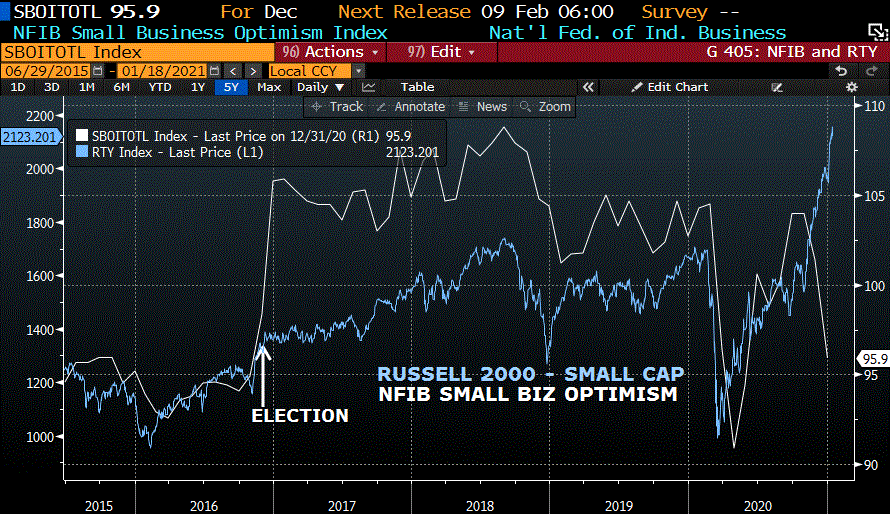
–While it’s tough to short any index future in the face of massive monetary and fiscal stimulus, the attached chart of the ratio of RTY to SPX indicates that upside resistance is getting closer (shaded area). As of Friday the value of one March Mini-Russell was $106,040 and of one ESH was $188,112.

Global Walls
January 17, 2021 – weekly comment
“The treasury market’s bears had better take notice; There’s a wall of global cash poised to swoop in and buy, likely limiting the upside in yields.”
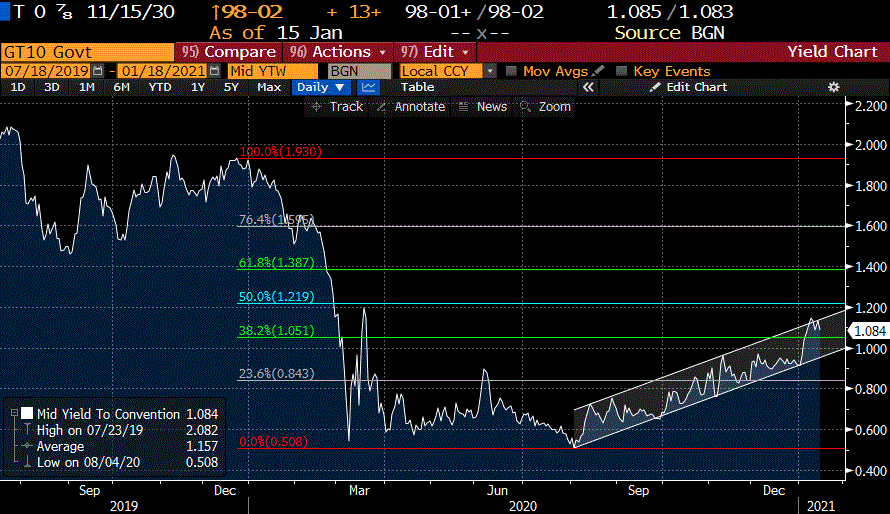
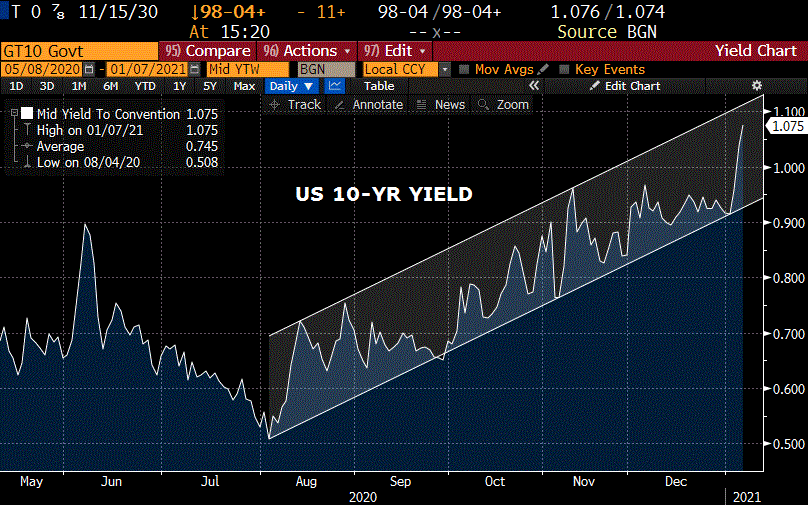
So begins a BBG article from this weekend by Liz Capo McCormick et al, who I respect as a journalist, but I think this piece widely misses the mark. The article cites a couple of asset managers who allow that yields of 1.25 to 1.3% on the ten year may draw buyers, and then falls back on Japan as this supposed “wall of cash”. From a short term perspective I agree that yields have run into resistance, and will likely drift sideways to lower this week. The chart below clearly shows resistance defined by an obvious upward channel. But the fact remains that there is a wall of supply on the way in the form of (continued) monster deficits. At the same time, inflationary signals continue to percolate across markets and the dollar remains vulnerable.
What about domestic buyers? With Fed officials leaving little doubt that rates are on hold, the carry is quite attractive. On top of that, Brainard, Clarida and Powell took pains to squelch any taper talk. From the Chairman:
The economy is far from our goals, and as I’ve mentioned a couple times, we’re strongly committed to our framework and to using our monetary policy tools until the job is well and truly done. The taper tantrum highlights the real sensitivity that markets can have about the path of asset purchases. We know we need to be very careful in communicating about asset purchases… We will, of course, be very, very transparent as we get close. I would just say this on the current situation, when it does become appropriate for the committee to discuss specific dates – when we have clear evidence that we’re making progress toward our goals – and that we’re on track to make substantial further progress towards our goals – when that happens and we can see that clearly we’ll let the world know. We will communicate very clearly to the public and we’ll do so, by the way, well in advance of active consideration of beginning a gradual tapering of asset purchases. So, that’s how we’re thinking about that.
In my opinion the Fed may soon be thinking about how to gracefully ADD to purchases in order to stem yield increases. There’s a lot of geopolitical uncertainty at this time along with constant coverage of virus outbreaks. While I feel the corner has been turned on covid, what’s fairly clear about the Fed is that perceived risks are met with monetary accommodation. The new framework makes it even easier for the Fed to default to ‘downside risks’ in making policy decisions.
I’ve personally been involved in trades where the thinking is “I’m probably ok from here. How much farther can it possibly go?” That is typically a very bad way to trade. You’re already in it and trying to justify to yourself that a turn is near. The answer is, FARTHER. I’ve also had a client use the phrase, “The road to hell is paved with positive carry”. What if, when Powell’s term ends in February of 2022, Biden nominates someone like Shaq? The carry earned over the next year will be but a passing memory.
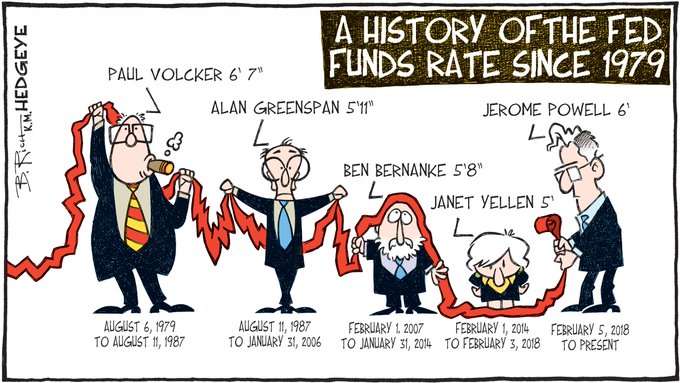
I’m just kidding of course (Shaq is 7’1”). But I am not kidding about the new framework institutionalizing the risk bias toward higher long end rates due to concerns about the Fed’s desire for higher inflation. U of M 1-yr inflation expectations popped up to 3.0% last week; 5-10 yr matched a five year high of 2.7%.
What follows are just a few charts that I’ve highlighted before that indicate to me that a bear market in bonds has commenced. Yes, jobless claims jumped back up to 965k, highest since August. Yes, it’s winter and no one wants to eat outside and all the holiday bar and restaurant parties were cancelled. Retail sales slowed. But pricing indicators seem to be gaining strength.
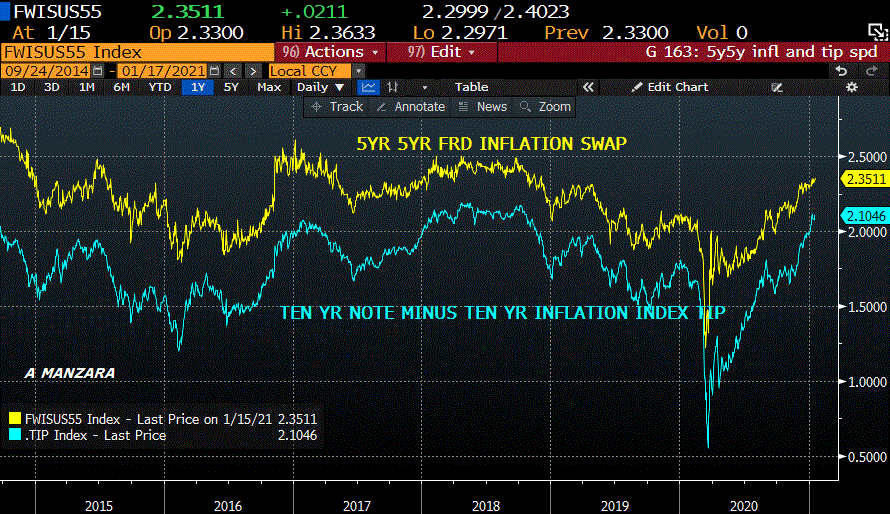
The first chart is the ten year vs inflation-indexed tip breakeven with the 5y 5y frd inflation swap. Both moving higher. However, Ben Breitholtz from Arbor Research cautions that the 2yr to 10yr tips breakeven has inverted the most since July 2008. He notes that “inflation expectations habitually peaked following inversions.” I can’t seem to replicate his chart; I’m just taking it on faith. The 5y breakeven is 214 to the ten year at 211, so slight inversion exists there.
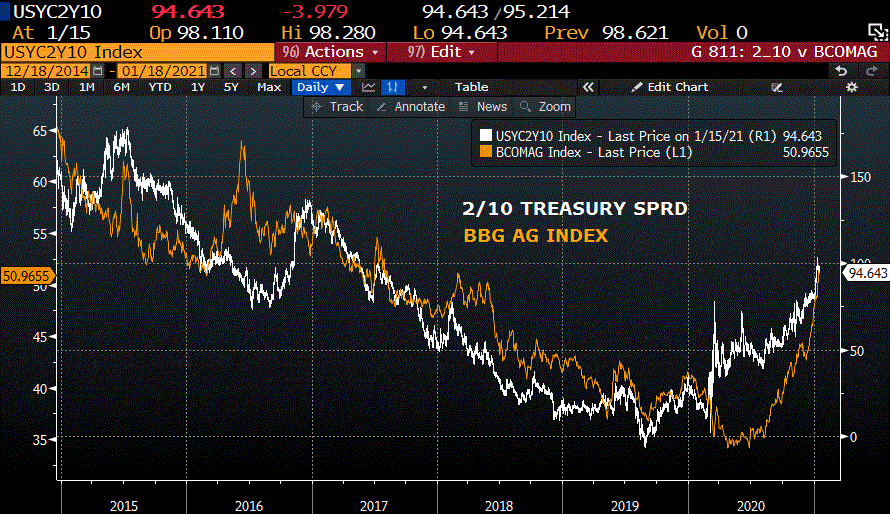
The next chart is the BBG Ag index, strongly breaking out to the upside, with 2/10 treasury spread, ditto.
It’s reported this week that the largest owner of farmland is none other than Bill Gates at 242,000 acres. Big tech versus real assets. Food security is a huge theme and this guy is exploiting it.
Not pictured, but Gundlach’s copper/gold ratio versus tens seems to forecast outperformance of the former indicating catch-up by the latter. Below is the BBG base metals index and the dollar index. Both seem to be breaking out, though it’s a bit early to draw conclusions on this one. Will be much clearer if 2018 extremes are surpassed.

This week includes the inauguration and a $24 billion twenty year auction on Wednesday.
OTHER MARKET THOUGHTS/ TRADES
On Friday the seller of EDU3 9950 calls continued his campaign, with another 40k sold at 17.5, bringing the cumulative total to at least 115k (total open interest in the strike is 129k). These calls have 974 days until expiration. On Friday, they settled 18.0 vs 9947.5 in the underlying; the 9950 straddle has been crushed, settling at 38.5 vs 42.5 the previous Friday ref 9942.0. If the market were to immediately trade down 40 bps, all else being equal, the calls would be valued just under 10. In three months, if futures remain here, all else equal, decay will provide a profit of 0.7 bps. If futures roll forward as indicated by the EDH3/EDM3 calendar spread at 7.5, then the EDU3 calls will be worth 17.4 in three months. (I am using March/June calendar rather than June’23/Sept’23 which is elevated at 15.5 due to the libor fallback timing). I don’t really see the rationale for clobbering long dated calls at relatively low vols, but would consider something like buying 2EU 9937/9912ps which settled 5.25 if I thought a near term adjustment to higher rates was probable.
Though I think bonds are in a bear market, a corrective rally seems plausible. From last week:
“I would be looking to buy call spreads in tens on weakness. TYG 136.75/137.25 cs settled 10 vs 136-21; I would hope to pay 8 or less there. Expiration is one week from Friday.” Settled 13 vs 136-275.
Goldman has upped its 2021 GDP forecast to 6.6%. US treasury bond vol remains compressed. I believe USH has a bit of room to rally in the early part of the week, to somewhere just above 170, retracing a bit of the damage done by the Jan 6 Dem sweep in Georgia. Look to buy USH put spreads on a rally.
| 1/8/2021 | 1/15/2021 | chg | ||
| UST 2Y | 13.5 | 13.5 | 0.0 | |
| UST 5Y | 48.2 | 45.3 | -2.9 | |
| UST 10Y | 111.5 | 109.5 | -2.0 | |
| UST 30Y | 187.2 | 185.2 | -2.0 | |
| GERM 2Y | -70.1 | -72.0 | -1.9 | |
| GERM 10Y | -51.9 | -54.3 | -2.4 | |
| JPN 30Y | 64.6 | 64.3 | -0.3 | |
| CHINA 10Y | 314.9 | 314.8 | -0.1 | |
| EURO$ H1/H2 | 2.0 | 1.0 | -1.0 | |
| EURO$ H2/H3 | 15.0 | 10.5 | -4.5 | |
| EURO$ H3/H4 | 38.0 | 39.0 | 1.0 | |
| EUR | 122.20 | 120.80 | -1.40 | |
| CRUDE (active) | 52.26 | 52.42 | 0.16 | |
| SPX | 3824.68 | 3768.25 | -56.43 | -1.5% |
| VIX | 21.56 | 24.34 | 2.78 | |
Long end weighed down by stimulus and price pressures
January 15, 2021
–Pressure on the long end continued Thursday with the 30y bond climbing 5.6 bps to 1.874% as Biden’s $1.9 trillion stimulus package was leaked. Tens rose 4.1 bp to 1.129 with the two year unchanged. 5/30 spread notched a new high for the move at 139. Powell was uneventful, saying that policymakers are going to be careful about communicating “well in advance” a reduction of bond buys (though treasuries slid after his comments). Trades in euro$ continue to favor downside, for example another 100k 3EH 9887 put were bought for 1.5, with the underlying EDH4 settling 9928. In terms of timing for a Fed hike, it’s somewhat interesting to look at the green pack (2023 contracts) relative to the blue pack (2024 contracts). Yesterday greens closed +0.25 while blues were -1.25, the spread settled 38.875. Red/green pack spread settled 24. I personally think the Fed will be forced into a hike by the middle of next year as the upcoming inflation data that Powell vows to look past will spark market action that can’t be ignored. Get ready for a bunch of “Is the Fed behind the curve?” articles over the next few months.
–Today’s news includes PPI, Retail Sales and Industrial Production. Equity option expiration and midcurve eurodollar option expiration. Ahead of Wednesday’s locked-down inauguration we will probably see some defensive buys in shorter treasuries.
Risk reversals
January 14, 2021
–Yields retraced a bit of the recent surge, with tens down 5 bps at 108.8. The combination of a strong 30-yr auction and Brainard’s comments provided midday support into the close. Key from Brainard:
The economy is far away from our goals in terms of both employment and inflation, and even under an optimistic outlook, it will take time to achieve substantial further progress. Given my baseline outlook, I expect that the current pace of purchases will remain appropriate for quite some time.
The important voices have dismissed the idea of the Fed tapering buys. Brainard, Clarida, and certainly Powell today. One other important snippet from her speech indicates the Fed is prepared to look past upcoming higher inflation data:
Inflation may temporarily rise to or above 2 percent on a 12-month basis in a few months when the low March and April price readings from last year fall out of the 12-month calculation, but it will be important to see sustained improvement to meet our average inflation goal.
–Powell’s term as chair ends Feb, 2022. Whether his term is extended or not, employment has been elevated to the prime mandate of the Fed.
–Implied vol declined yesterday. In dollars, the seller of EDU3 9950c added with 20k more at 16.5, bringing his total to 70k (settled 18.25 vs 9944.5). Long dated straddles lost 2.5 to 3.5 bps. Vol on the US contract slipped to a recent low as the cash bond yield retraced 6.7 to 181.8. USH 169 straddle settled 3’18 or 7.6 vs 169-12. One bond (USH1) point is worth about 4.75 bps. Given recent strength in grains, copper, oil, etc, bond vol seems quite low, even if the Fed is willing to look past price hikes. BBG noted a new high in the 5y 5y inflation forward in Europe. And of course there are pockets of rampant speculation in equities reminiscent of the late 1990’s. See PLUG, GME, etc. In dollars, the hedge against inflation is taking place through midcurve risk reversals. Art Main of TJM summarizes:
We also continued to see interest in downside via risk reversals in midcurves as follows:
+10k 3EH1 99.00/99.625 risk reversal at 2.5 (+p -c) position add ~ 30k
+10k 3EM1 98.875/99.625 risk reversal at 5 (+p -c) position add ~ 32k
So this brings total positions across all structures to greater than 180k as we saw similar flows over the last two weeks via the following structures:
+40k 0EM1 99.25/100.25 risk reversal at 2.5 (+p -c)
+50k 2EH1 99.25/100.25 risk reversal covered 99.71/99.805 delta .05/.04 between 0.25 and 0.5 (+p -c)
+30k 3EH1 98.875/99.625 risk reversal covered 99.305 delta .10 at 1 (+p -.c)
News of tapering is premature
January 13, 2021
–Early morning weakness in fixed income subsided after the ten year auction; yields ended only modestly higher. Tens up 0.7 bp to 113.8. 2/10 squeaked to a slight new high of 99.3. Eurodollars were flat to down 1 out to five years. Today’s news includes CPI, expected +0.4 month/month with yoy Core 1.6% (last at 1.6). Beige book released this afternoon in front of the Jan 27 FOMC. Brainard speaks at 1:00pm on the economy, which could be an important event. An article on BBG this morning notes: “In the past week, four of the Fed’s 18 policy makers have publicly raised the prospect they may discuss reducing bond buying – currently running at $120 billion a month – by year’s end. In contrast, several others have called the debate premature and Fed VC Clarida, the most senior central banker to weigh in, has said he doesn’t expect any changes before 2022.” So today Brainard, who will probably become the next Fed Chair, weighs in, followed by Powell tomorrow. While Fed officials still lean towards a slight downward risk in inflation (according to Clarida), markets have taken a different view. Since November, WTI is up 43% from around $37/bbl to $53. Corn is up 33% over the same timeframe, from about $4 to this morning’s $5.32. A story on ZH citing FreightWaves.com notes: “It has never been more expensive to get a container of goods across the ocean.” (The article is mostly about anomalies in LNG shipping). And, in terms of asset price inflation: “The percentage of NYSE stocks above 200-day moving averages has surpassed 90% for the first time since 2009. This rare event has happened only 5 times using weekly data going back to 1974.” The dollar has had a small bounce which feels like its fading.
–The BBG article cited above voices some concerns about a repeat of 2013’s “taper tantrum”, but I think a reduction in bond buying will have a more negative impact on stocks than bonds. In any case, Brainard and Powell will defer the idea of tapering any time soon in the quest for official inflation readings above 2%. By then, of course, it will be too late!
–Decent buying yesterday in TYG 137c which traded mostly 4 but settled 6 ref 136-125 with an open interest jump of 51k. These were the most heavily traded TY call and expire on the 22nd, two days after the inauguration.
Yields march higher
January 12, 2021
–Interesting session Monday which featured continued steepening and a push to higher yields. Tens rose 2.1 to 113.1. Back month euro$ calendars have exploded over the past week as sentiment has shifted. Red/gold euro$ pack spread (2nd yr forward vs 5th year forward) rose over 4.5 on Monday to 98.5, equaling 2/10 which closed 98.8 (+1.3). Red/gold was 72 on Jan 4, so it’s up 26.5 in six sessions. As another example, EDH3/EDH4 (green/blue March) settled yesterday at 41 from 28.5 on Jan 4. There was particularly heavy trade once again in Blue March midcurve puts, with the standout being a buy of >100k 3EH 9887p for 2.5 (settled there vs 9924). Taking advantage of this trade, there was a buyer of 20k 9912/9900/9887 put tree for 0 (settled 0: 6.5, 4.0, 2.5). These trades give some sense of how the market has positioned: the thought had been to keep premium outlays low by expressing a short, but selling extra downside puts, because after all, the market hasn’t shown true downside follow-through in years. Now we see a reach to cap off open-ended downside risk, even as others dismiss the possibility.
–What has contributed to the shift? Biden is unveiling his multi-trillion stimulus package on Thursday, just as treasury attempts to auction $38b in tens today and $24b thirties tomorrow. I suppose that can cause a ‘concession’. TYH currently at a new low 136-07.
–This may or may not fall under the heading of speculative excess, but Jan bitcoin futures fell 5740 or 14% yesterday to 33780. On the same topic, here’s a snippet from Jeremy Grantham’s piece: “…my personal favorite Tesla tidbit is that its market cap, now over $600 billion [yes he’s off by $200 billion, but that was DAYS ago] amounts to over $1.25 million per car sold each year versus $9000 per car for GM.” Grantham minces no words and says it’s all a bubble.
–In other news, the FBI is warning of general protests which may break out into something “mostly peaceful”. A private collector of “decommissioned surplus military equipment” helpfully chose yesterday to have a tank delivered by being driven down the streets of Palmetto Bay, Florida. I don’t mind tanks in the streets, just don’t cut off my social media feeds… And the mayor of Washington is advising those planning to attend festivities associated with Biden’s inauguration to stay home. All nine of them. [too early?]
LMF Acquisition Opportunities
January 10, 2021 – Weekly Comment
In the late 1990’s, the dot-com bubble was in full force. Companies that wanted to attract investors to boost stock valuations simply added “dotcom” to their business names. There were a lot of crazy listings. What popped into my mind, and this of course is NOT crazy, is Pets.com. Look around today, and everyone has some sort of emotional support pet, a fact that has probably helped many weather the covid storm. *raises hand*. Pets.com had a famous sock puppet as its mascot (allegedly modeled after the unparalleled Triumph the Insult Comic Dog, see bottom), and the company went on an advertising blitz to gain market share. Partially backed by Amazon, Pets started operations in early 1999. According to Wikipedia, “…during its second fiscal year the company continued to sell merchandise for approximately 27% less than cost, so the dramatic rise in sales during Pets.com’s second fiscal year only hastened the firm’s demise.” How do we do it? VOLUME! Going public at $11 in February 2000, the company almost perfectly top-ticked the market; Nasdaq posted its bubble top in March 2000. By November, the stock was trading at $0.19 and the company declared bankruptcy.
For a bit of background on conditions, I lifted this from thebalance.com:
In 1998, GDP was 4.5%, unemployment was 4.4%, and inflation was 1.6%
In 1999, GDP was 4.8%, unemployment was 4.0%, and inflation was 2.7%
In 2000, GDP was 4.1%, unemployment was 3.9%, and inflation was 3.4%
In 2001, GDP was 1.0%, unemployment was 5.7%, and inflation was 1.6%
So there was a round-turn in inflation from 1998 to 2001. In ’98 the Fed had cut the FF target to 4.75% in the wake of the LTCM blow-up. By March of 2000 (again, the Nasdaq top) it had been jacked to 6% in a series of 25 bp increments, and in May, the coup de grace 50bp hike to 6.5%. By the end of 2001 the Fed had slashed the target to 1.75%. Nasdaq had more than doubled from its Oct 1999 low of 2300 to reach 4816 in March ’00. In another year (March 2001) it was 1700.

And now, fittingly announced by the Pets mascot, we present to you, LMF Acquisition Opportunities!
From the Preliminary Prospectus, and no, I am not making this up (thanks HB for the link!):
LMF Acquisition Opportunities, Inc. is a newly organized blank check company formed for the purpose of effecting a merger, capital stock exchange, asset acquisition, stock purchase, reorganization, or similar business combination with one or more businesses, which we refer to as our initial business combination. While we may pursue an initial business combination target in any business, industry or geographical location, we intend to focus initially on transactions with companies and/or assets within the financial services industry, including potentially the financial technology (“FinTech”) sector, and related sectors. We have not selected any specific business combination target and we have not, nor has anyone on our behalf, initiated any substantive discussions, directly or indirectly, with any business combination target.
https://www.sec.gov/Archives/edgar/data/1831868/000156459021000649/lmao-s1.htm
That’s right. Yesterday’s news: dot-com. Today’s innovation: SPACs. No product. No plan. Brilliant!
“Our sponsor, LMFAO Sponsor, LLC, a Florida limited liability company, has agreed to purchase an aggregate of 4,598,000 warrants at a price of $1.00 per warrant…in a private placement that will close simultaneously with the closing of this offering.
We have applied to list our units on The Nasdaq Capital Market, or Nasdaq, under the symbol “LMAOU”
Is that ‘laughing my ass off’ WITH you, or AT you?
I’m sort of old school, in a Frank the Tank way, but I think that LMAOU, if it flies, though exceptionally well-timed to coincide with bitcoin in the fintech sphere, and brilliantly conceived as a marketing tool for the Robinhood crowd, is a sign that perhaps there is too much liquidity sloshing around.
In terms of liquidity, President-elect Biden vows to get the $2000 payments out, and has said his stimulus package will be in the “trillions of dollars” the details of which he will reveal on Thursday. Stocks are at all time highs. The dollar index has started the year at lows not seen since early 2018. Bitcoin has gone up 4x to $40k since October. And the treasury is set to auction $120 billion of debt this week: $58b 3s on Monday, $38b 10s on Tuesday and $24b 30s on Wednesday. With, as we like to say “more behind”. Now of course our friendly central bankers can help the market absorb that supply. However, long-end buyers are quite a bit less enthusiastic recently as can be seen by recent curve moves to new highs.
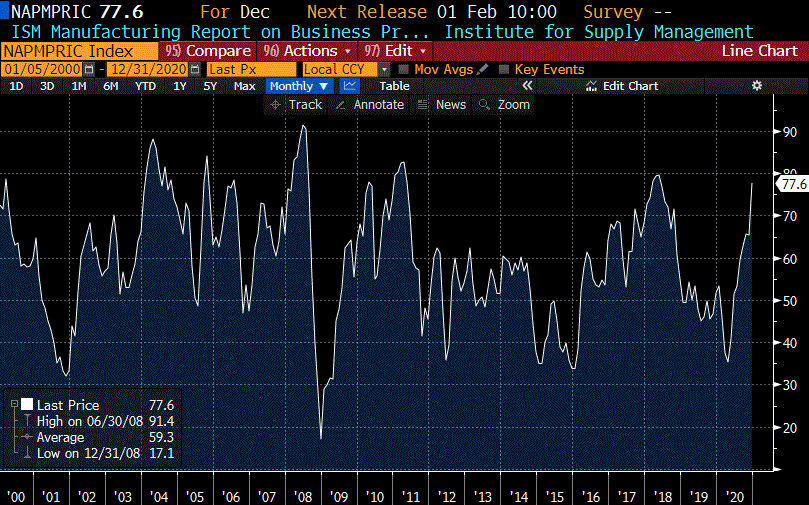
From Dec 31 to Friday, 2/10 has gone from 79.6 to 97.6, 17 bps. 5/30 from 128 to 138.5. And red/gold Eurodollar pack spread (2nd year to 5th year) from 72 to 94, or 22 bps. Refer back to data from thebalance above. Inflation went from 1.6% to 3.4% in two years. That was with the Fed hiking in an environment of positive real rates. Sure, the Fed has vowed to fund juicy positive carry for a couple of years, but what happens if little clues like Friday’s yoy Avg Hourly Earnings print of +5.1% and last week’s ISM MFG Prices Paid of 77.6 (high since the 2018 peak of 7.5) are not just one-offs, but are a sign that inflation is actually becoming entrenched?
The 5/30 treasury spread trades at the high of the year at 138.6, and the attached chart shows that print just matches the high of the Trump presidency. Just after the election, 5/30 traded 139.7 on November 10, 2016, as an expected surge in economic activity was expected due to tax cuts and loosened regulatory constraints. The Fed had the same expectation and began ‘normalizing’ with both rate hikes and balance sheet tapering. By July 2018, the curve signaled the Fed had gone too far as inversion occurred in the red/gold euro$ pack spread; it had peaked over 100 after the election and is 94 now. The $50 billion per month balance sheet tapering which started in October 2018 combined with the last Fed hike in December of that year was the final straw and SPX declined by a third in Q3 2018.
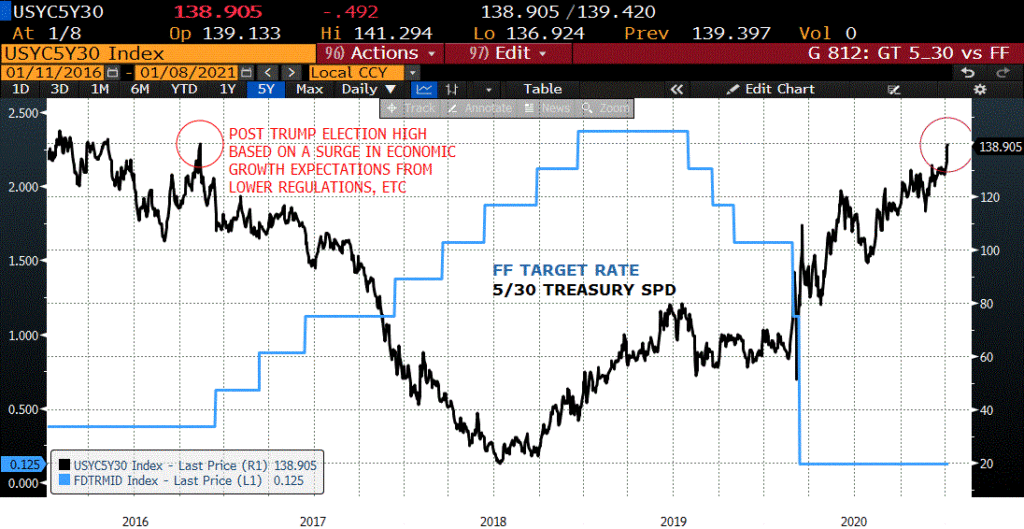
Now we have a federal government spending spree and a Fed which vows to accommodate it. Happy days. By the way, the high of this century thus far in 5/30 is just over 300 bps in November of 2010.
OTHER MARKET THOUGHTS/ TRADES
A lot was packed into the first week of 2021. Democrats won control of the government with a sweep of the Georgia Senate run-offs. The US Capitol was mobbed in the wake of a pro-Trump rally. Clarida gave a speech on the economy.
2020 was a year of mob mentality. It swept through major cities abetted by mayors and politicians, fueled by social media and mainstream news alike. Businesses and livelihoods were looted, burned and destroyed. Hopefully it culminated with last week’s episode abetted by Trump, but I doubt it.
It is the case of an unlawful mob, which in itself is a crime; a mob bent on mischief; a mob that has no rights. They are too dangerous. It is like a fire. One man may do something. Two will do a much more; three will do more than three times as much; a crowd will do something that no man ever dreamed of doing. The law recognizes it. It is the duty of every man–I don’t care who he is, to disperse a mob. It is the duty of the officers to disperse them. It was the duty of the inmates of the house, even though they had to kill somebody to do it. Now, gentlemen, I wouldn’t ask you to take the law on my statement. The Court will tell you the law. A mob is a criminal combination of itself. Their presence is enough. You need not wait until it spreads. It is there, and that is enough. There is no other law; there hasn’t been for years, and it is the law which will govern this case.
The excerpt above is from Clarence Darrow’s closing argument in defense of Henry Sweet in 1925. Nearly one hundred years ago. It’s a long piece. I’ve provided a link below.
In the markets, I believe there is also mob mentality at work, supported in part by the monetary authorities. Clarida’s speech on Friday made no mention of financial stability; he stuck to the two original mandates of employment and inflation, the latter in the context of the Fed’s new averaging framework. He said, “Although a little more than half of participants judged risks to be broadly balanced for economic activity, a similar number continued to see risks weighted to the downside for inflation.” I would not argue that curve measures currently warrant a Fed change, but things could easily reach the point where the Fed misses the signal to provide restraint, just as it missed the signals in Q3 2018 on the other side.
From late 2011 through 2019, the ten year yield stayed within a range of just over 300 bps to around 140; a low of 136 occurred in July 2016. That lower end of the range should now provide upside resistance. On a shorter timeframe, last week’s high just over 111 bps hit the upper channel which has been in place since August. I would expect a bit more pressure in the early part of the week before the auctions wrap up, and then a rally in the context of what has now become a bear market in the long end. Wednesday brings CPI with PPI on Friday. The move in both the ten year yield and the gold pack in Eurodollars (5th year forward) are of about the same magnitude as the one which occurred June 2nd to 5th of last year as stocks were running and there was a blockbuster employment report. At that time tens jumped from 63.6 to 89.6 or 26 bps, and golds fell about 29 bps. Currently tens have gone from 91.4 on Jan 4, to 111.7 or 20.3 while EDM25 has fallen from 9911.5 to 9885 or 26.5.
| 12/31/2020 | 12/31/2020 | chg | ||
| UST 2Y | 11.9 | 13.5 | 1.6 | |
| UST 5Y | 35.8 | 48.2 | 12.4 | |
| UST 10Y | 91.0 | 111.0 | 20.0 | w/I 111.5 |
| UST 30Y | 164.0 | 186.8 | 22.8 | w/I 187.2 |
| GERM 2Y | -70.0 | -70.1 | -0.1 | |
| GERM 10Y | -56.9 | -51.9 | 5.0 | |
| JPN 30Y | 64.4 | 64.6 | 0.2 | |
| CHINA 10Y | 314.6 | 314.9 | 0.3 | |
| EURO$ H1/H2 | 1.0 | 2.0 | 1.0 | |
| EURO$ H2/H3 | 7.5 | 15.0 | 7.5 | |
| EURO$ H3/H4 | 28.5 | 38.0 | 9.5 | |
| EUR | 121.77 | 122.20 | 0.43 | |
| CRUDE (active) | 48.52 | 52.24 | 3.72 | |
| SPX | 3756.07 | 3824.68 | 68.61 | 1.8% |
| VIX | 22.75 | 21.56 | -1.19 | |
https://en.wikipedia.org/wiki/Pets.com
https://www.thebalance.com/fed-funds-rate-history-highs-lows-3306135
https://www.famous-trials.com/sweet/124-darrowsum
Like putting out fire…with gasoline
January 8, 2021
–The model seems to be that you incite the crowd in a certain direction, then stand idly by as it spins out of control. And I’m talking about the Fed here…monetary accommodation to exceed 2% inflation. Add in the prospect of fiscal fuel and watch runaway asset inflation. The Fed has promised to be “credibly irresponsible” and Clarida speaks today at 11:00 on monetary policy and the economy, where he will bolster that message.
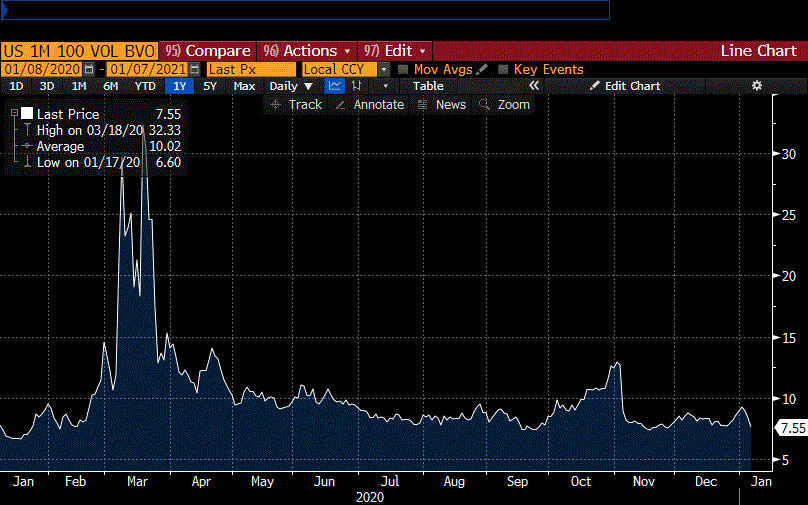
–Curve made new highs yesterday, with 2/10 at 93.2, up 3.6, and 5/30 138.8, up just 0.2. In euro$, red/gold pack spread hit a new high of 88 bps, up 5.625. Ten year tip breakeven to 211.6. The ten year yield rose 3 bps to a new high of 107. The odd feature of the move is that implied vol, especially in bonds, has been declining, as the attached chart shows. There are a lot of reasons to believe that rising yields and a steeper curve will take a breather, and lower bond vol certainly supports that thesis. (chart below). Of course, today’s employment report may also be a factor, with NFP expected +50k, but there are some estimates of a negative print. Rate expected 6.8% with yoy wages 4.5% vs 4.4 last time.
–There were a few large trades yesterday, notably a roll from long TYG 137 puts into TYH 136.5 puts, 45k x 60k. The peak open interest in TYH puts has thus shifted to the 136.5 strike with 183k open. That strike corresponds to a yield around 1.115%, which is the upper channel line on the attached 10y chart. In dollars, a buyer of 20k 2EM 9950p for 5.5 ref 9961, settled 5.25 vs 61.5 and a buyer of about 15k 9937p as well. 0EM 9925/10025 risk reversal, 0.25 paid for the put 40k ref 9978.5.
A bunch of f’ing bond traders
January 6, 2021
–Markets don’t like Republican loss of Senate control. Stocks down, bonds down, dollar down. Commodities are stronger: WTI over 50 (Saudi oil cuts), March Corn over $5, and bitcoin topped $35k. Tens are over 1% with TYH 137-08. The modest threat of inflationary impulses may turn into palpable fear as the Fed has promised to stand by idly while a new government sees a mandate to spend and regulate. ISM mfg prices paid at 77.6 (chart attached) soared in yesterday’s report and is near the 2018 peak…sign of things to come?
–Several trades from yesterday seemed to anticipate the move. Buyer of 30k TYG 137.75/137.25/136.75 put tree for 3 covered 138-005. Two and a half weeks to go for this one and the market is now right at the middle strike. Buyer of at least 5k TYH 136.5/135.5 put strip with two of the 135.5 puts for 28 to 31; settled 30 vs 137-27. The large short open interest in the 137 puts (both Feb and March) may spark more protective buying of lower strike puts.
–In eurodollars there was a buyer of 60k 0EU1 9975/9962p spread for 3.0, settled 2.75 vs 9979.5 in EDU2. Recall that prior to the libor extension this contract had been trading in the lower 9960’s. Also a buyer of 15k EDZ2 9950/9925ps for 2.25 to 2.5, settled 2.5 vs 9974.0.
–When Bill Clinton was president, there was a somewhat famous quote from him, “You mean to tell me that the success of the economic program and my re-election hinges on the Federal Reserve and a bunch of fucking bond traders?” Greenspan used the opportunity to make a deal with Clinton, indicating that the Fed would keep interest rates low if Clinton would rein in the budget. It worked. It’s different this time.
–In the current environment there’s likely to be a lot more pressure on the Fed (even more than there was from Trump) to monetize unbridled spending. Strap in, it’s going to be fun.
https://nymag.com/nymetro/news/bizfinance/columns/bottomline/199/
Tips forecast inflation
January 5, 2021
–Despite the 1.5% decline in both SPX and Nasdaq on the first trading day of the new year, interest rates were little changed on Monday, with tens ending at 91.3 bps. However, downside option protection was bought in both tens and eurodollars, and vol firmed in front of today’s Georgia Senate runoff elections.
–One interesting level pertains to the ten year inflation-indexed note which closed at a new low of negative 112 bps. The breakeven closed at a new high of 203.3. The last time the ten year tip was near this level at -110 in early Sept, Feb Gold was 1986. Yesterday it was 1946.6 at settle, which was up $51.50.
–Even with a modest pullback in stocks, VIX nearly hit 30 before coming back to close just under 27.
–EDU1/EDU2 settled at a new recent low of 3.0, down 0.5 on the day, indicating little chance of the Fed being forced to move up a tightening schedule. Despite new lows in the dollar and a surge in commodities (for example, March Corn gained over 15% from the start of December) the rates market is quite certain that any inflationary impulses will be viewed as temporary.

