If it’s priced in dollars, it’s higher
January 4, 2021
–The dollar index is kicking off 2021 on a new low as the yuan strengthens past 6.5 for the first time since 2018. Gold has soared $40 with GCG1 at 1935, and silver is up over $1 at 27.50. Stocks, of course, are at new record highs. Corn is up 11 cents nearing $5/bushel. The depreciation of the world’s reserve currency is giving everything priced in dollars a boost, foreshadowed by the weekend surge in bitcoin to over 34k. Somewhat surprisingly, treasuries are only seeing very small losses, even as the tip breakeven closed just above 200 bps on Friday.
–Not much to report from Thursday besides a buyer of 20k 2EM 9950/9925ps for 2.5. Settled 2.25 ref 9970. The underlying contract is two and a half years away, easily enough time for the Fed to actually move, but this trade depends on forward perceptions. A Georgia flip to Dems might do it. Trump’s entreaties to Georgia officials to find more votes may backfire spectacularly.
–Marginal new lows in the first eurodollar one-year calendar spreads. The front spread is now EDH1/EDH2 which closed 1.0, down 1 on the day. June/June settled 2.5, Sept/Sept 3.5 and Dec/Dec 4.5. Given some predictions of t-bills trading negative in the early part of the year, compression in these spreads doesn’t make a lot of sense.
Banquets
January 3, 2021
Sooner or later, we all sit down to a banquet of consequences. -Robert Lewis Stevenson
A crust eaten in peace is better than a banquet partaken in anxiety. -Aesop
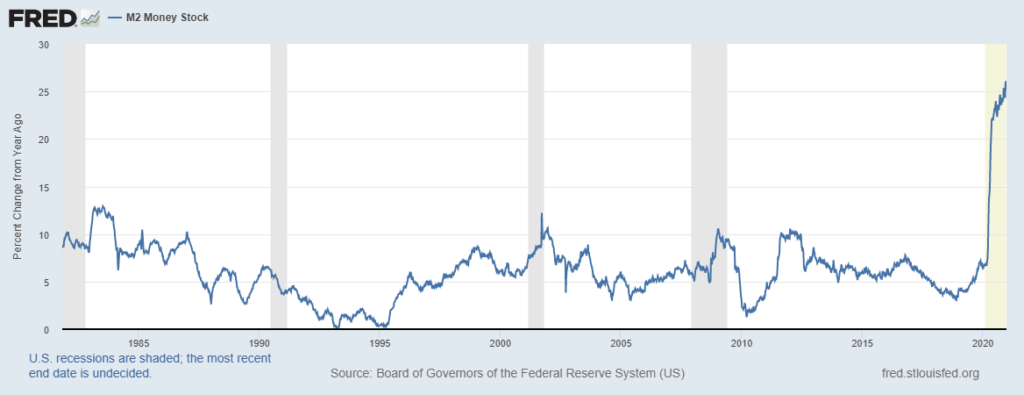
I’ve posted a graph of M2 growth before, and anyone reading this is familiar with the extraordinary stimulus from both fiscal and monetary policy in 2020. But this is still a stunning chart, with yoy growth in M2 at over 25%, more than double the previous high over the past forty years. That high was in 1983 at 12.6%. At that time, CPI was around 3.5%, down from a peak 14.7 in 1980. Unemployment was 8.5 to 9% down from a high of 10.7 in 1982. The ten year treasury yield was 10-11% down from a peak 15.8 in 1981. For that brief period the UST ten-yr provided a real yield somewhere around 7%. Now it’s negative 1%.
The question of course is, are we still in the process of setting the table for the ultimate banquet, or are we simply reaping the beneficial outcomes of soaring equity prices and low interest rates? I labor under the (now suspect) theorem that borrowing now, whether by government or the private sector, is pulling future economic activity forward. Here are a couple of market snippets for 2020: IPO issuance has nearly doubled from the old record. Blank-check SPACs have proliferated. From BBG: “At a time when headlines were dominated by a raging virus, recession, and the fastest ever bear market, a record $120 trillion of stock changed hands on US stock exchanges this year, up 50% from 2019 to a record.” From Q3 2019 to Q3 2020 Fed’l Govt debt rose 22% and Business debt rose 8.6%. Are there no consequences?
There’s a great scene in the animated film Ratatouille (thanks RL) where the famed and feared restaurant critic Anton Ego addresses his hapless waiter, saying, “…you know what I’m craving? A little perspective. That’s it! I’d like some fresh, clear, well-seasoned perspective. Can you suggest a good wine to go with that?” The flummoxed waiter hems and haws as Anton continues, “Perspective. Fresh out, I take it? Very well, since you’re all out of perspective and no one else seems to have it in this bloody town, I’ll make you a deal. You provide the food. I’ll provide the perspective, which would go nicely with a bottle of Cheval Blanc 1947.” He is, of course, served the peasant dish ratatouille, and on his first bite he’s magically transported back to childhood in his mother’s rustic kitchen…
These markets seem to have lost perspective. But the table of consequences is being set. Stocks are at record highs with pockets of rampant speculative excess. Gold has gained 25% this past year with silver up 47%. BBG Agricultural (BCOMAG) index is up 15% on the year, and up 40% off the mid-year low. The base metals spot index (CMDIBASS) is up 19% and 50% from the year’s low. From my viewpoint, commodities, agricultural and oil, appear relatively cheap in comparison with financial assets. Here’s the ratio of SPX to the BBG Commodity Index.
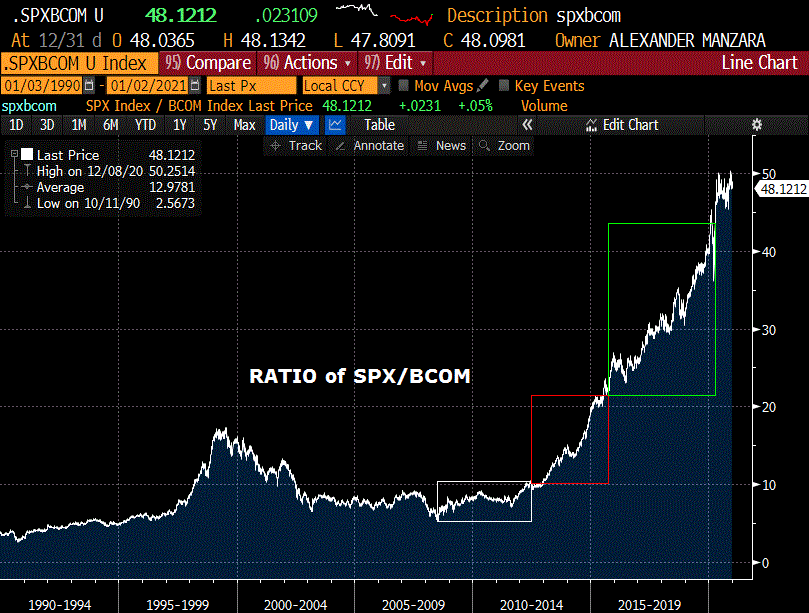
I have a rule of thumb about speculative excess. My disclaimer is that it’s probably not particularly useful. Strong trends double three times and then become very unstable. On my ratio chart above, it took about 4 years for the first double off the 2008 low. Then a bit over 3 years to double again, then 4 and a half years to double again. Of course, something like TSLA has done the triple-double (and more) just in the space of this year off the split-adjusted low of 70 in March. Nasdaq doubled three times off the 2008 low when it reached 8200 in 2019, and is going for 4x having ended the year at 12888.
A few years ago, the narrative regarding the Fed was that it was operating with three mandates: price stability and full employment (the original two) with financial stability completing the triad. The Richmond Fed released a paper in June 2017 with the rhetorical title, ‘Does the Fed Have a Financial Stability Mandate?’ It included this line: “The Financial Stability Oversight Council (FSOC) comes closest to an agency responsible for financial stability…formally charged with identifying risks… promoting market discipline by reducing the expectation of government bailouts… ” With respect to the Fed: “Despite relatively vague financial stability deliverables, it is very likely that lawmakers and financial market participants expect the Fed to take strong actions to achieve stability. This raises some potential problems that remain unresolved.” FSOC seems to have fallen a little flat with respect to reducing expectations of bailouts. Given the Fed’s new average inflation targeting, my view is that potential problems regarding financial stability will come to bear this year. As an addendum, the ten year treasury to tip breakeven spread ended the year just over 200 bps, the high since Q4 2018 when the FF target was 2.0-2.25%.
Georgia Senate elections on Tuesday. ISM Mfg also on Tuesday; Jobs report on Friday. Minutes of the Dec FOMC on Wednesday. Several Fed speakers through the week, the most important of which is likely Clarida on the economy and monetary policy on Friday.
OTHER MARKET THOUGHTS/ TRADES
I personally bought some Jan VIX 32.5 calls for 1.00 last week (not a recommendation). However, I’m not sure there’s enough time for this to play out. For example, a solid SPX rally in the last half of 2017 was followed by a 7% burst in January with the new tax package. The top was on January 26, followed by a rapid 11% drop. The difference now is that post-inauguration tax reform will be in the opposite direction.
Implied vol in treasuries firmed into the end of last week in front of this week’s news schedule. In tens, the 137 put remains the peak of open interest, signifying a strike just above the 1% yield level; cash tens closed the week at 91 bps vs TYH1 138-025. TYG 137p have 186k open, while TYH 137p have 76k. That mostly represents shorts against long 138’s on ratio trades. A win by Dems on Tuesday would likely cause a jump in yields, though Friday’s employment data should be a counterbalance, with NFP expected at just 50k.
There were a few trades Thursday protecting against a yield surge. 2EH 9925/100.25 risk reversal traded 0.25 covered 9975, bought put 50k. The put alone settled 0.25 vs 9974.5 in EDH23. 2EM 9950/9925ps bought for 2.5 20k. Settled 2.25 ref 9970.0 in EDM23.
| 12/24/2020 | 12/31/2020 | chg | ||
| UST 2Y | 12.7 | 11.9 | -0.8 | |
| UST 5Y | 38.2 | 35.8 | -2.4 | |
| UST 10Y | 93.3 | 91.0 | -2.3 | |
| UST 30Y | 167.1 | 164.0 | -3.1 | |
| GERM 2Y | -70.5 | -70.0 | 0.5 | |
| GERM 10Y | -54.8 | -56.9 | -2.1 | |
| JPN 30Y | 62.4 | 64.4 | 2.0 | |
| CHINA 10Y | 322.9 | 314.6 | -8.3 | |
| EURO$ H1/H2 | 2.0 | 1.0 | -1.0 | |
| EURO$ H2/H3 | 8.0 | 7.5 | -0.5 | |
| EURO$ H3/H4 | 30.0 | 28.5 | -1.5 | |
| EUR | 122.15 | 121.77 | -0.38 | |
| CRUDE (active) | 48.23 | 48.52 | 0.29 | |
| SPX | 3703.06 | 3756.07 | 53.01 | 1.4% |
| VIX | 21.53 | 22.75 | 1.22 | |
https://www.richmondfed.org/publications/research/economic_brief/2017/eb_17-06
they can’t revoke your soul for tryin’
Dec 31, 2020
What a long strange trip it’s been.
-Grateful Dead lyric from Truckin’
–That’s the song spinning in my head this morning as we wrap up 2020. Strange year. Not much to comment on in the rate market; yields eased a shade yesterday with tens down less than 1 bp to 92.6. Only two things worth mention, first, EDZ1/EDZ2 one-year calendar settled at new recent low of 5. The last month’s range has only been 5.5 to 8.0. Doesn’t look particularly out of line, and there is no real turn effect (this year should have taught us that). 2021 last working day is Friday Dec 31, and last working day in 2022 is Friday Dec 30. So the one-year forward spread at 5 continues to signify a Fed on hold, but I am inclined to be a buyer of cheap year spreads.
Second, treasury vol firmed, a bit strange before another long weekend. Example, USH 173 straddle settled 4’26 yesterday even as the contract drifted toward strike, settling at 172-27, while it was 4’18 on Tuesday.
–Happy New Year to all.
You’re sick of hangin’ around and you’d like to travel
Get tired of travelin’, you want to settle down
I guess they can’t revoke your soul for tryin’
Get out of the door and light out and look all around
Bitcoinfinger
December 30, 2020
–GBP is around 1.3580 this morning, pressing for a close at the high of the year. It’s at the highest level since early 2018. Last night I watched a classic James Bond movie, Goldfinger. In the scene where Mr Goldfinger wants to extract an outrageous global ransom, the amount is given as “280 million dollars… one hundred million pounds”. So GBP has to pull a bitcoin and double from here to get back to its value in 1964! The dollar index appears to want to close out the year on its low, currently it’s 89.75. Maybe 2.80 GBP isn’t all that farfetched as the US seeks to churn out another $2k direct deposit to the populace. March Euro made a new high this morning and is currently 1.2300.
–Corn also rallied to the year’s high yesterday, closing at 466, a solid, continuous rally from the August low around 330. Rates however, remain quite subdued. TYH1 settled unch’d at 137-29+ with a cash yield of 93.3 as sevens were auctioned. Red through gold eurodollars settled +0.5. Volume was light.
–Opposite of corn, gold’s high of the year was made in early August, and it’s been a series of lower highs and lower lows since then as institutional money has been swayed by the siren call of bitcoin. However, USD depreciation should keep a floor under it.
Curve 4th Turn
December 27. 2020 – Weekly note
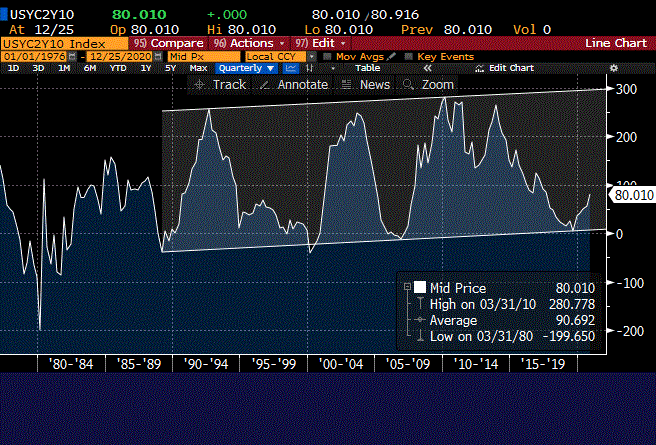
Above is a long-term chart of the 2/10 treasury spread. Easily identifiable thirty-plus year range with three distinct 300 bp surges. The first starts in 1989 and tops in 1992, associated with the Savings and Loan crisis and the Gulf War. Over this time frame the Fed cut the FF target from 9.75% to the then historic low of 3% in Q3 1992. The peak of 2/10 coincided almost exactly with the last ease. Throughout 1993, the rate was 3%.
The second surge goes from Q2 2000 to Q3 of 2003. The main factor was the bursting of the Nasdaq bubble and of course, 9/11. In 2000, the FF target was 7.5%. By June 2003 it was cut to the then historic low of 1% where it remained for the next ten months. The curve peaked within a couple of months of the last ease, topping in September 2003.
The Great Financial Crisis sparked the third surge, from the end of 2006 to Q3 2010. Beginning in Q3 2007 the Fed cut the target from 5.25% to zero by the end of 2008. It took another year and a quarter for the curve to top.
Armed with only this information and this chart, one could easily draw several conclusions about the future. 1) we’re in a ‘fourth turning’ where the 2/10 spread will claw its way back to 300. 2) some sort of bad financial juju is going to be associated with the next couple of years. 3) the Fed is going to ease.
The problem, of course, is that the FF target is already at the lower effective bound. This leaves the Fed with a couple of alternatives: First, quantitative easing and second, targeting a much lower value for the US dollar on global markets. The choice, of course, appears to be “both”.
From 1995 to the middle of 1996 there was a wiggle higher in the curve as the Fed cut rates from 6.0 to 5.25%. The magnitude of that steepening was slightly less than the current one, but it also started at a marginally higher level. Is the current move analogous to that one, or can the Fed do “whatever it takes” to undermine the dollar and generate inflation, thereby vaulting the 2/10 curve to 300 once again? I would suggest the latter.
Surge number one took 39 months from bottom to top. Surge number two took 36 months. Surge three took 36 months. The bottom of the current move was August 27. 2019. It has been in effect for 16 months. Friday’s close was just over 81 bps. We should be near 300 sometime around Q3 of 2022.
In terms of a bad financial catalyst, of course we have the Covid situation which has sparked massive monetary and fiscal accommodation. I can’t help but feel as if the Nashville bombing is also the start of something larger. The recorded warnings pre-explosion suggest communication infrastructure was a target, differentiating this from a terrorist attack. Recent cyber hacks of critical systems, and the fact that the FAA has closed down airspace around downtown Nashville and said that “deadly force” could be used on any security threat increases the level of concern.
OTHER MARKET THOUGHTS/ TRADES
The treasury auctions 2s, 5s and 7s on Monday and Tuesday in total size of $176 billion. Demand for a safe harbor will likely allow clear sailing for these issues. but the massive size in a holiday shortened week where many have closed the books could still cause a hiccup.
The theme of large trades last week suggests that 5 and 10 yr futures will sit in a tight range the next couple of weeks. Large trades include a buyer of 20k FVH 125.75/126/126.25 call tree for 0.5; settled 1.0 vs 126-02. Buyer of 50k TYH 138/137/136.5 put tree for 6; settled 7 vs 137-28. Buyer of 50k TYG 138/137p 1×2 for 6; settled 11 vs 137-28.
| 12/18/2020 | 12/24/2020 | chg | ||
| UST 2Y | 12.1 | 12.1 | 0.0 | w/I 12.7 |
| UST 5Y | 38.0 | 36.9 | -1.1 | w/I 38.2 |
| UST 10Y | 94.6 | 93.3 | -1.3 | |
| UST 30Y | 169.8 | 167.1 | -2.7 | |
| GERM 2Y | -72.5 | -70.5 | 2.0 | |
| GERM 10Y | -57.1 | -54.8 | 2.3 | |
| JPN 30Y | 62.4 | 62.4 | 0.0 | |
| CHINA 10Y | 330.2 | 322.9 | -7.3 | |
| EURO$ H1/H2 | 2.5 | 2.0 | -0.5 | |
| EURO$ H2/H3 | 8.5 | 8.0 | -0.5 | |
| EURO$ H3/H4 | 30.0 | 30.0 | 0.0 | |
| EUR | 122.58 | 122.15 | -0.43 | |
| CRUDE (active) | 49.24 | 48.23 | -1.01 | |
| SPX | 3709.41 | 3703.06 | -6.35 | -0.2% |
| VIX | 21.57 | 21.53 | -0.04 | |
Make money by standing still
December 23, 2020
–Relatively quiet day marked by a few large trades that benefit from rangebound price ranges with compressed vol to take advantage of time decay. For example, buyer of 20k FVH 125.75/126/126.25 c tree for 0.5 with the contract just at and slightly above the middle strike. Settled 0 vs 126-02. Fills out at expiry between 126-00 and 126-08. Late in the day a large block buyer of TYH 138/137/136.5 put tree for 6. Over 50k traded. Settled 7 vs 137-315. Same version in Feb settled 15, so there’s your decay over four weeks. Also an early buyer of 4k TYH 138/139 c 1×2 for 8.
–Jan treasury options expire Thursday.
–Headline on the FT site: “Fed backstop masks rising risks in US corporate debt market …Record 2.5tn borrowing binge has caused debt levels to balloon faster than profits can keep up.” Moving right along to more important news, Trump is holding up the covid bill in order to give Americans who frittered away their first stimulus checks by buying food and paying rent a second chance at Robinhood accounts with $2000 checks. I don’t know that this is even true, but the current bill apparently includes $130 million for Nepal, “including development and democracy programs”. I hope there’s some sort of matching grant for the US to work on democracy programs as well.
–March Corn settled 443 1/2 a new high. March beans settled 1250, a new high. Take THAT QuantumScape!
Merry Christmas and Happy Festivus, Alex
Mutant virus worries fade
December 22, 2020
–Monday started with mutant virus fears, but concerns seem to have dissipated as the day progressed.
–Buyer of 50k TYG1 138/137p 1×2 for 6 covered 137-25 with 5d, Settled 6 vs 137-245. This appears to be a roll-up of long 137 puts, which were crushed by this trade. To give an idea, on Friday TYH settled 137-24. The 137/138 p 1×2 settled 4. Change of 2/64’s at the same futures level. On Friday, the 137/138.5 risk reversal settled 5 vs 137-245, 20 for the put and 15 for the call. Yesterday the call was unch’d at 15 but the put declined 2 to 18.
–Recall that in October, on the 20th, ppr paid 3 for 50k TYZ 139/138/137.5 p tree vs 138-24. At that time there were 31 days until expiry. Now everything is exactly a point lower, with 31 days left for Feb expiry, and the TYG 138/137/136.5p tree settled 13! ( 42 18 and 11 ). Obviously the risk/reward parameters have changed over time.
–News today includes revision to Q3 GDP exp 33.1 same as last. Existing home sales as well and Conference Board Consumer Confidence expected 97 from 96.1
Zeus and Kronos
December 21, 2020
–Large reversals this morning across markets. Crude oil down nearly 6%, ESH down 1.75%, GBP down 2.25% as is copper. A series of factors could be catalysts, 1) “sell the fact” as the US finally passed a $900 billion stimulus package 2) a new more infectious strain of Covid in the UK to ring in the new year 3) lack of a Brexit deal 4) TSLA’s inclusion into the S&P 5) continued adjustment to index rebalancing after Friday’s December expiration 6) the conjunction of Jupiter and Saturn, which should be quite a sight. (As Ron Burgundy might say, “…by the beard of Zeus”).
–In any case, the holiday week will feature thinner than usual market conditions with the possibility of exaggerated moves.
–Net changes in interest rate futures remain muted, though the curve steepened to new highs on Friday. Tens rose 2 bps to 94.6 while thirties added 2.4 bps to 169.8. 2/10 spread ended at 82.5 (+2.4) while 5/30 finished at 131.8 (+1.7). Again, these levels have been erased with the start of a new week, with tens currently 90.5
–On Friday there was a buyer of 4EH 9912/9887/9875p 1x3x2 ratio fly for 4.5 ref 9913.5. Likely able to buy this trade for lower premium today.
–Jan treasury options expire Thursday at 12:15 Chicago time. Check with your clearing firm for manual exercise/abandon time cut offs.
All the same trade
December 20, 2020 – Weekly Comment
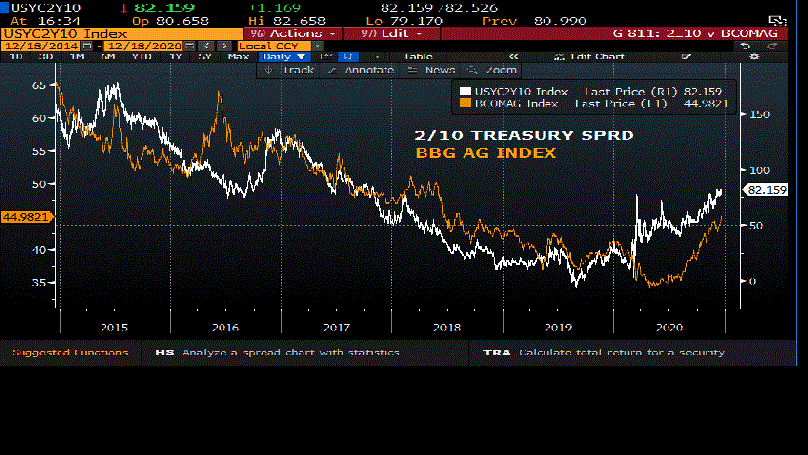
Above is a chart of the 2/10 treasury spread overlaid with Bloomberg Commodity Index. Like everything else, there appears to be a fairly high degree of correlation. In any case, 2/10 is at a new high for the year over 82 bps, a level not seen since late 2017.
It doesn’t really matter what data series one looks at. Almost everything is closing at the high or the low of the year. Dollar index, new low. Stock indices, new all-time highs. 2/10, new high. Red/gold euro$ pack spread, new high (since early 2017). Ten-yr tip breakeven, new high. Corporate spreads at or near the low of the year. Bitcoin, new all-time high. Soybeans, matching the high of 2016. Corn at 437 is at the high of the year, but about 30 cents away from last year’s peak, and a little over half the price of the all-time high in 2012. Copper, high since 2013. In a way, precious metals are laggards; victims of the great bitcoin rush. While gold is within $40 of the 2011 spike high of $1921, it’s not at a new high for the year (high in Sept was 2075). Silver is even more of a slacker: the high in 2011 was 50, but it’s now only about half that level and over $4 shy of this year’s high of 30. Bunker Hunt’s time has come again! WTI Crude is now near $50/bbl, but started the year around $64, and the high in 2008 was over $145/bbl.
Let’s take a closer look at 2/10. The level is 82, high of the year. High in 2010, the all-timer, is 291. The short maturity leg of any curve trade is handcuffed by the Fed’s promise to keep funding rates low. Longer maturities are thus constrained by low funding levels. Long treasuries are one asset class not marked by extreme levels. For example, the ten-yr yield started the year at 188 and is now 93 bps below that level as the Fed lopped 150 bps off the FF target early this year. The thirty-yr was 233 bps on Jan 2, and is now 63 below that level at 1.70%. Perhaps bonds aren’t as constrained by low funding rates as the markets (and Fed) assume. In terms of that assumption, here’s a quote from Jerome Powell’s press conference:
If you look at PEs, they’re historically high. But in a world where the risk-free rate is going to be low for a sustained period, the equity premium, which is really the reward you get for taking equity risk, would be what you’d look at. And that’s not at incredibly low levels, which would mean that they’re [stocks] not overpriced in that sense. Admittedly, PEs are high, but that’s maybe not as relevant in a world where we think the 10 year treasury is going to be lower than it’s been historically from a return perspective.
The question becomes, can some of these things reverse without affecting the others? For example, can stocks continue to rise even if bond yields press higher? This would necessarily imply a steeper curve, given the locked short end. Perhaps it’s instructive to go back to 1987. The ten-year started at around 7%, and the yield rose to over 10% as the DJIA was on its way to a 43% increase into September. The FF target was raised from 6 to 7.25% over the first three quarters of 1987. Of course, the crash occurred in October, taking the Dow down 28% from September’s high to the end of the year. The ten year fell from 10.23 to 8.75%.
My point is only that a lot of markets are at yearly extremes and are correlated, likely because of the remarkable liquidity provided by the Fed. Long end yields have more room to the upside than the market currently perceives. Of course, a sharp stock reversal would take yields down. Therefore, 2021 is probably a year for spread trading. For example… sell copper, buy silver?
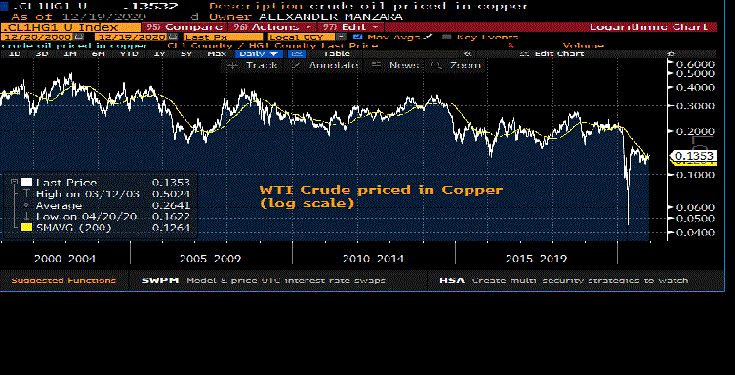
Along this line of thought, the chart below is WTI Crude priced in copper (log chart, CL1/HG1). I’ve seen several analysts justify high copper prices due to the incredible expanding demand due to electric vehicles. This chart would appear to support that thesis in that oil is trending lower when priced in terms of copper. However, a contrarian couldn’t be faulted for going the other way on this one!
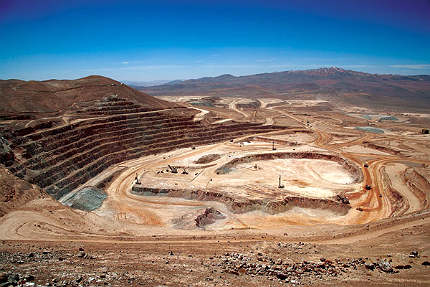
By the way, while everyone smugly believes they’re saving the planet from fossil fuel extraction by driving electric, it’s worth noting that copper mining can leave planetary scars as well. Here’s a picture of the Escondida mine in Chile. That’s where copper comes from.
| 12/11/2020 | 12/18/2020 | chg | ||
| UST 2Y | 11.9 | 12.1 | 0.2 | |
| UST 5Y | 35.9 | 38.0 | 2.1 | |
| UST 10Y | 89.1 | 94.6 | 5.5 | |
| UST 30Y | 162.4 | 169.8 | 7.4 | |
| GERM 2Y | -78.3 | -72.5 | 5.8 | |
| GERM 10Y | -63.6 | -57.1 | 6.5 | |
| JPN 30Y | 61.1 | 62.4 | 1.3 | |
| CHINA 10Y | 331.1 | 330.2 | -0.9 | |
| EURO$ H1/H2 | 2.0 | 2.5 | 0.5 | |
| EURO$ H2/H3 | 7.5 | 8.5 | 1.0 | |
| EURO$ H3/H4 | 29.0 | 30.0 | 1.0 | |
| EUR | 121.12 | 122.58 | 1.46 | |
| CRUDE (active) | 46.75 | 49.24 | 2.49 | |
| SPX | 3663.46 | 3709.41 | 45.95 | 1.3% |
| VIX | 23.31 | 21.57 | -1.74 | |
Cyber security (and inflation)
December 18, 2020
–Once again, little net change in rate futures, however, bonds failed an early upside move and the thirty-yr ended up rising 1 bp to 1.675%. Most curve measures are within a bp of the year’s high, with 2/10 just over 80 bps and 5/30 just over 130. Red/gold euro$ pack spread is 72.25. DXY made a new low for the year yesterday, and ten year inflation-indexed breakeven is also at a new high, nearing 2% at 196.3.
–Philly Fed was a large miss at 11.1, but there was little effect on prices. While gold and silver have pulled back from strong rallies yesterday, Dec bitcoin remains above $23k after yesterday’s 1940 surge to 22870.
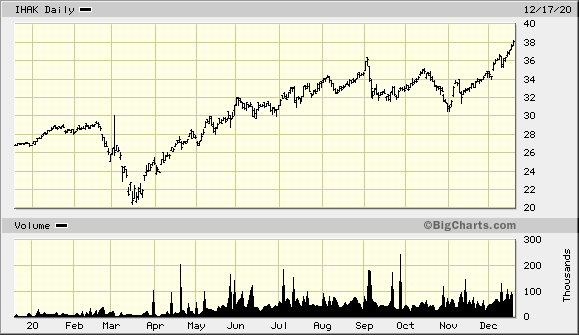
–Reports of sustained hacks on critical network systems are becoming a huge issue. The MSFT president called the SolarWinds breach an “attack of recklessness”. “The Microsoft numbers illustrate just how targeted this attack was. The hackers behind this supply chain compromise had privileged access to 18000 enterprise networks and followed up on only 40 of them.” These are nation-state hostilities that, in my opinion, eclipse the trade wars. From a CNN piece: “I woke up in the middle of the night last night just sick to my stomach.” said Theresa Payton, who served at White House Chief Info Officer under President George W Bush. “On a scale of 1 to 10, I’m at a 9 –and it’s not because of what I know, it’s because of what we still don’t know.” Friends at the The Institutional Strategist had long ago recommended Cyber-security ETFs. Maybe it’s late to the game, but check out IHAK making new highs. (There are several others as well).
–Several friends have noted that bitcoin loses a bit [ALL?] of its virtual luster in the event of an internet shutdown. On a more mundane level, security issues are necessary business inputs where costs will likely be passed on to the consumer. Here’s a clip from Gavekal’s summary of ten things that have changed last year:
To put this another way, for 20 years, every company’s procurement process was driven by the price-to-quality ratio: could a potential supplier produce an adequate product at a low enough price point. That was then. Today, after actions against Huawei, ZTE, Semiconductor Manufacturing International, the equation, at least in China (the world’s second largest economy) has changed. Above all else, what now matters most is the security of the supply and the price-to-quality ratio has slipped down the list of priorities. This represents a paradigm shift as “Ricardian optimization” is no longer the be-all and end-all. A world that worries more about safety than low prices is one that will likely deliver lower productivity, and higher prices.
–We’re worried about safety measures like masks and social distance, while dependence on network systems pervades every aspect of modern life and is met with indifference.