
Requires more study
December 16, 2020
–Yields pushed a bit higher as stocks soared. Tens +3 bps at 92. Front end was dominated by trades consisting of 1/16% wide put and call spreads. For example, buying of approx 10k EDM1 99.8125/99.75p spread for 1.5 ref EDM1 9982.5/83. When it’s all about pegging forward contracts to the tightest 1/16th, it doesn’t paint a pretty picture for the future of the contract. On the other hand, there’s a bit of life in the long end. Late buyer of 8k TYG 167/169ps for 18 covered 173-01 with 9 delta. Actually, that’s not particularly exciting either, with 2 points in the bonds equating to a little over 9 bps.
–It’s against this backdrop that the FOMC meets, with the biggest drama being the size and composition of bond buying. It’s clear that the massive balance sheet expansion has juiced up big tech stocks and the Robinhood crowd. I suppose now all it takes is a bit of fine-tuning? By the way, DXY at a new low for the year, just above 90. In February, just before the Covid inspired volatility, it was 100. Drop of ten percent…
–Reuters cites a study by JPM: “US households across the board built up savings during the pandemic, but low-come households are burning through their cash more quickly than higher-income families and could be out of savings soon if more aid is not delivered, according to a [JPM] studly released on Wednesday.” No sh-t, huh? If the guys on this study were in another time, they probably would have been working on something like the Manhattan Project or Hubble telescope. It’s turning into a Kafka novel. Here’s a link to an angry and frustrated restaurant owner confronting covid regulators:
Sounds like this guy has burned through a lot of cash trying to survive. Obviously there needs to be more of a fiscal response, which Powell will likely emphasize again. Hero of the day for helping to plug the gap: Mackenzie Scott, who has given away $4 billion in 4 months! (It’s a write-off JK).
–Other news today includes Retail Sales expected -0.3 but +0.1 excluding autos and gas. Markit Composite also released, it was 58.6 last.
Corn and gold
December 15, 2020
–Quiet session Monday which featured an underlying bid for FI. Tens ended unch’d at 89.1. Vol edged lower. In eurodollars, EDM1 9975 puts were bought for 1 in size of 25k, settled there vs 9983.5. The new 9981.25 put settled 2.5, which is below breakeven given current libor settings around 22 bps. There’s widespread agreement that inflation data will likely see a nice jump at the start of Q2 due to base effects, but no concern that the Fed’s response will consist of anything more than a shrug.
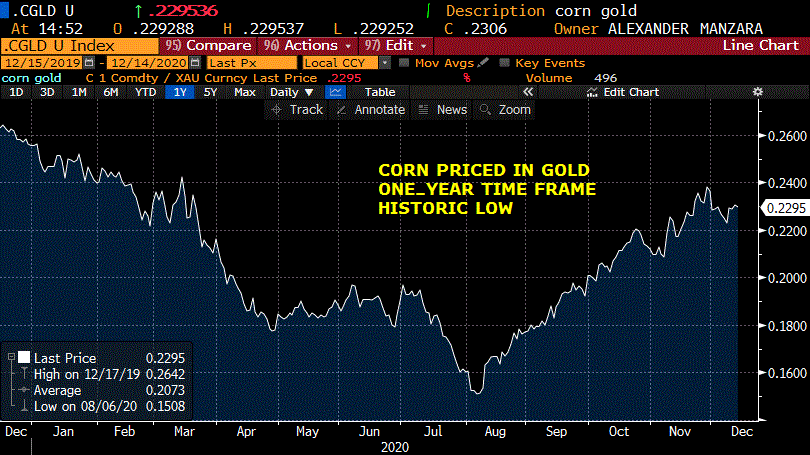
–On July 29 of this year I put out the following tweet, noting that Corn priced in terms of Gold had made a historic low. I had forgotten about it, but a friend (thanks TRS) mentioned that it was extemely close to the low of this year.
Below are updated charts over a 20 year and 1 year horizon. Interestingly, this bottom corresponds with the ten-year yield historic (end-of-day) yield of 50.8 on August 4. The rally so far hasn’t violated the downward sloping trend, but there has been a lot more interest recently in the gold/copper ratio and in industrial metals/commodities. By the way, yesterday was the first time the ten-yr Inflation-indexed note settled below -1.0% since early September. Unsurprisingly, gold has rebounded this morning.

Negative t-bill yields projected
December 14, 2020
–Friday’s session was dominated by front end buying as the FT highlighted a BAML report from Mark Cabana forecasting negative t-bill rates into Q1. The Treasury General Account balance is approx $1.5 trillion. According to the article, “…that leaves the treasury needing to allow somewhere between $500 and $900bn of T-bills to mature in the first half of the year without being replaced by new issuance.” There was a buyer of 100k EDU1 at 9981 on Friday with an associated increase in open interest of 48.6k. The ‘new’ white pack, beginning with EDH1 was up 1.5. The peak ED contract is EDM1 at 9983.5. The all-time high tick for any euro$ contract was 9989.5 for the second red (6th quarterly) on May 8 of this year.
–The ten year yield fell 1.5 bps to 89.1 on Friday. Just as a comparison, in early May when euro$ contracts were posting all-time highs, the ten year yield was 68 bps. Tens eventually made a new low yield at 50 bps in early August. The two-year ended at 11.9 bps, down 1.8, flirting with all-time low of 10.7 from July 31.
–EDH1 vs FFJ1 (a proxy for libor/ois) settled at 10, down 0.5 on the day, a new low. Today marks the final settle for EDZ0. FOMC announcement and press conference on Wednesday.
Lift the curtain and act the play
December 13, 2020 – Weekly comment
Lift the curtain and act the play
Weekly Comment – December 13, 2020
Alex Manzara/ RJO-Interest Rate Strategy and Execution/ amanzara@rjobrien.com
The final FOMC meeting of the year takes place this week. Does it make any difference? Oh there’s going to be some additional chart information immediately released with the Summary of Economic Projections rather than that data being delayed three weeks. There will perhaps be changes in bond buying composition. But for the most part, it’s just shuffling chairs around the deck.
I think there could be parallels between the current environment and the taper tantrum which followed Bernanke’s comments in Congressional testimony May 22, 2013. Not in terms of an instant bond sell off, but more in terms of a longer term earth-shaking reaction to the hubris of global central bank control. From a Reuters piece, here’s the May ’13 quote and its outcome:
“If we see continued improvement and we have confidence that that’s going to be sustained then we could in the next few meetings… take a step down in our pace of purchases.” Bond yields rocketed higher and stock prices dropped. Financial conditions over the ensuing months tightened, surprising the Fed.
This week I reviewed the transcript of the FOMC meeting just before that event, which sparked that jump in yields – from late May to Sept the 10-year yield went from 2% to 3%. A surprising amount of commentary at that meeting concerned the BoJ’s expansion of its QE program. Here’s Simon Potter:
Meanwhile, equity gains in Japan were particularly pronounced, with the TOPIX up over 11 percent in local currency terms in response to the BOJ’s new measures aimed at ending Japan’s persistent history of deflation. Specifically, the BOJ will now seek to achieve 2 percent inflation within two years by doubling the monetary base by the end of 2014, mainly through a sharp increase in purchases of longer-duration Japanese government bonds (JGBs).
There it is again, the elusive holy grail of 2% inflation being discussed seven years ago, through the mechanism of long-term bond buying. And there it is again, a liquidity boost directly injected into stocks. The definition of insanity. Potter continues:
While investors were expecting some shift of purchases to longer-dated JGBs, the size of the shift was significantly larger than had been expected. ..yields on 10-year and 30-year JGBs initially declined 12 to 30 basis points. Subsequently, JGB yields have retraced, though, on net, 10-year and 30-year yields remain 15 to 30 basis points below their late-February levels, when expectations for longer-duration asset purchases began to firm. There is likely a range of contributing factors to the retracement, though it is difficult to quantify them or even rank their importance.
You squeeze on one part of the liquidity tube of toothpaste and it bulges somewhere else. You want it to come out of the tip and be deposited on the toothbrush where it can do some beneficial work. But if the cap is on it just moves around. Former Dallas Fed President Fisher had this to say in the meeting:
I just want to reiterate my mantra: Unless fiscal and regulatory policy incents business to use the cheap and abundant capital we’ve made available, it will not be used to create jobs to the degree that we desire. It will be used to set the stage, but it cannot lift the curtain and act the play.
There was an interesting statement by Rahm Emanuel after he was installed as mayor of the City of Chicago following his stint in the Obama administration. “I don’t create jobs. I create the environment, the atmosphere and the platform for success in the private sector.” [which creates jobs]. The Tribune article of May 13, 2013 from which this quote is taken has this additional snippet: “Setting the stage for job growth has been a major component of Emanuel’s agenda, including development of a 10-point plan, the wooing of 14 company HQ’s and the launch of programs aimed at cutting city red tape.” When Emanuel was Obama’s Chief of Staff, it was all about political infighting: ”You never want a serious crisis to go to waste.” But as a big city mayor, it’s all about delivering jobs and services and infrastructure and incenting the private sector. At least it used to be. I hope he joins the new administration to lend that perspective.
Amazingly, it was Kocherlakota that was spot on in terms of anticipating the market reaction to a hint of tapering:
The Committee raised the target at the June [2004] meeting by 25 basis points, and then proceeded to do the same at the next 16 meetings before stopping two years later. The parallel in the current circumstances is that tapering would be the first step of the exit process and would be followed in relatively short order by the Committee’s raising the fed funds rate. These types of beliefs mean that there is a risk that any tapering of our purchases could be seen as the signal of a rapid decrease in the level of accommodation, and it follows that tapering could generate a much sharper tightening of financial conditions than we currently anticipate.
Fast forward to 2020. The central bank playbook is now all about controlling bonds, though it is shifting more focus on currency movements as Lagarde alluded to on Thursday. Here’s a clip from Bloomberg’s ‘5 things’ on Friday:
The European bond market is all but dead. The latest action from the ECB – which has extended its pandemic bond buying program and added another 500 billion euros – is another nail in the coffin. Even before Thursday’s decision, investors were feeling muscled out of the market. Volumes in bund futures have slumped more than 60% since the ECB started buying bonds and yield ranges have collapsed across the region… The ECB will own roughly two-fifths of each of its two largest sovereign markets, Germany and Italy, by the end of next year…
Of course, the BoJ has further extended asset ownership, becoming the biggest owner of the nation’s stocks with a portfolio of 45.1 trillion yen ($434 B) surpassing holdings of the Gov’t Pension Investment Fund (BBG). None of it seems to be generating self-sustaining growth or consistent 2% inflation. (So let’s do more).
The Central Banks have accomplished the goal of sucking the life out of interest rate markets. Below is a table of CME Group open interest in selected interest rate products. It shows declines across the curve, although the positive changes in blue and gold euro$ midcurve options (E3 and E4) indicate a pulse after 2 to 3 years in the ZLB desert. A decline of 25% in five year futures open interest when the government is running gargantuan deficits? Sure, the Fed will buy that stuff, and yields won’t move.
| CME OI | 12/10/2020 | 1 yr ago | % change | |
| ED FUTS | 10.153 | 12.486 | -18.7% | |
| TY FUTS | 3.229 | 3.679 | -12.2% | |
| FV FUTS | 3.176 | 4.257 | -25.4% | |
| TY OPTS | 2.358 | 3.676 | -35.9% | |
| ED OPTS | 24.542 | 46.592 | -47.3% | |
| E0 | 2.793 | 7.875 | -64.5% | |
| E2 | 2.780 | 3.693 | -24.7% | |
| E3 | 3.375 | 1.821 | 85.3% | |
| E4 | 0.215 | 0.085 | 152.9% |
When I was on the CBOT floor ages ago, standing in front of the 30 year bond pit, which was then the most heavily traded interest rate contract, I used to watch the Dean Witter desk at around 10:35 to 10:40 a.m. Why then? Because that was Fed time, when the Fed engaged in matched sales or repos. John Fife at that desk would invariably flash large orders into bonds which were based on these Fed actions. There were no announcements. If the Fed unexpectedly did matched sales, it could be a signal of tightened policy. Dealers had dedicated “Fed watchers” to interpret the actions of the desk. Now, as Frances Donald at Manulife said on a BBG interview Friday, the central banks are concerned with climate change, racial diversity and affordable housing. My question is whether continually communicated guidance on central bank policy, leading to complacent certainty on rates and stocks, is valuable economic dynamics. Is the hand a little TOO visible? Could it lead to unexpected outcomes, as Kocherlakota prophesied?
Donald forecasts weaker upcoming labor numbers, followed by a jump in official inflation data by April as base effects kick in. She thinks the market will look past those numbers, but still suggests wildly asymmetric inflation outcomes between goods and services.
https://www.bloomberg.com/news/audio/2020-12-11/surveillance-fixed-income-with-holland-podcast
The markets convey valuable signals, and their unfettered functioning provides for both profit and risk mitigation. These days the Fed worries about “smooth functioning” of markets, but seems to have relegated risk signals to the back seat. However, surges in industrial metals and other commodities suggest that liquidity is seeping out to unexpected places.
OTHER MARKET THOUGHTS/ TRADES
Door Dash and Airbnb went public this week with a combined valuation somewhere around $160 billion. It’s not the food delivery service that has value, it’s the coding that optimizes every aspect of that service with a recurring revenue stream. Airbnb isn’t selling hotel rooms, it has harnessed technology to allow individuals to monetize their real estate for lodging. Bitcoin has a current market cap of about $350 billion. It’s the value of the code. Of course, at one time radio was all the rage:
In the five years prior to the Great Crash of 1929, RCA stock soared from about $11 to its September 1929 high of $114 (adjusted for the 5 for 1 stock split in February of that fatal year). That’s an appreciation of 936% in only five years — equal to an annual compound return of a monumental 60%. Also unbelievingly incredible was the fact it never paid a cash dividend! Investors didn’t care, since the stock value increased almost daily. At its 1929 peak RCA boasted an astronomical price/earning ratio of 72:1. By 1931 it was $10.
Short end yields declined fairly sharply last week. EDH1 +3.5 from 9979.5 to 9983.0. EDH2 +5.0 from 9976.0 to 9981.0 and EDH3 +6.0 from 9966.5 to 9973.5, as Mark Cabana from BofA suggested that a huge balance in the Treasury’s General Account could lead to a lack of t-bill supply with yields going negative in the first part of the year. The Fed would likely prevent SOFR from going negative. The two-year yield fell 3.2 to 11.9 bps, and the thirty year bond declined 10.6 to 162.4. I wouldn’t be surprised to see a rebound in long end rates following the Fed meeting.
Given the yield declines this week and the prospect for higher official inflation numbers, again look to blue or gold June midcurve puts. The expiration of December will serve to make these more liquid.
| 12/4/2020 | 12/11/2020 | chg | ||
| UST 2Y | 15.1 | 11.9 | -3.2 | |
| UST 5Y | 42.1 | 35.9 | -6.2 | |
| UST 10Y | 97.2 | 89.1 | -8.1 | |
| UST 30Y | 173.0 | 162.4 | -10.6 | |
| GERM 2Y | -74.7 | -78.3 | -3.6 | |
| GERM 10Y | -54.7 | -63.6 | -8.9 | |
| JPN 30Y | 65.0 | 61.1 | -3.9 | |
| EURO$ H1/H2 | 3.5 | 2.0 | -1.5 | |
| EURO$ H2/H3 | 9.5 | 7.5 | -2.0 | |
| EURO$ H3/H4 | 30.5 | 29.0 | -1.5 | |
| EUR | 121.21 | 121.12 | -0.09 | |
| CRUDE (active) | 46.26 | 46.57 | 0.31 | |
| SPX | 3699.12 | 3663.46 | -35.66 | -1.0% |
| VIX | 20.79 | 23.31 | 2.52 | |
https://www.federalreserve.gov/monetarypolicy/files/FOMC20130501meeting.pdf
https://www.bloomberg.com/news/audio/2020-12-11/surveillance-fixed-income-with-holland-podcast
In: Eurodollar Options
Central banks more of the same
Dec 11, 2020
–As we lead up to the last FOMC of the year next week, and the possibility of a tweak to Fed bond purchases, I’ve thought a bit more about the taper tantrum from 2013. To that end, I reviewed the April 30-May 1 2013 FOMC meeting transcript. I’ll likely write more about this over the weekend, but on a day of light trade volume without much else to comment on, I’m just using this excerpt for a daily note.
Below is a quote from Dallas Fed President Richard Fisher at that meeting. Note, this meeting was just prior to Bernanke’s May testimony that kicked off the tantrum.
“And I would say for the nth time, for the googolplex time, as I’ve argued at this table, I just want to reiterate my mantra: Unless fiscal and regulatory policy incents business to use the cheap and abundant capital we’ve made available, it will not be used to create jobs to the degree that we desire. It will be used to set the stage, but it cannot lift the curtain and act the play. And it has, I believe, had a wealth effect, but principally for the rich and the quick—the Buffetts, the KKRs, the Carlyles, the Goldman-Sachses, the Powells, maybe the Fishers—those who can borrow money for nothing and drive bonds and stocks and property higher in price, and profit goes to their pocket. But it has not done much, at least it seems to me, looking at the data, to put people back to work to earn a living by the sweat of their brow.”
There are those who accuse the Fed of being ignorant to the wealth disparities caused by QE. But of course, the Fed is not ignorant, as articulated seven years ago by Fisher. They know they’re the only game in town due to the inability of Congress to provide stimulus. There’s another tie-in to Fisher’s remarks that’s appropriate given the Fed’s release of the Z.1 quarterly report yesterday. That’s the “lead a horse to water but you can’t make him drink.” We have low rates that aren’t being exploited by businesses for productive growth, they’re being recycled into financial engineering.
Anyway, the Z.1 report contains summary stats on borrowing for major sectors of the economy. I have always thought of households, business and the Federal government as each being about a third of annual borrowing, each with about a third of the debt outstanding. For example, consider these debt levels for Households, Non-fin Business, and Federal Gov’t from the end of 2017: HH $15.015T, Biz $14.545T, Fed’l G $16.607T. Today we rec’d levels for end of Q3: HH $16.406T, Biz $17.544T and Fed’l G $22.993T. So over nearly 3 years, HH +9.3%, Biz +20% and Fed G +38%. Of course this has a lot to do with the Fed’l govt filling the COVID gap. But it also leads to gov’t crowding out, due to massive debt levels. And if regulatory burdens increase with the new administration, businesses will be dis-incented to use cheap capital for productive investment.
A billion here, a billion there, it adds up
December 9, 2020
–Another stimulus proposal, another day of new highs for stocks. There was some pressure on the front end of the market as three years were auctioned yesterday. Also a buyer of EDH1 9975p for 1 with the contract at 9979.5. The two year yield edged up slightly, everything further back on the curve drifted lower in yield. Tens auctioned today. Volume was again light. There is continued interest in Feb TY puts, with buying yesterday of 134 and 135 strikes in size of 10k, settled 3 and 9 ref 137-26. The 137p has the most open interest at 79k as long Jan puts are rolled.
–The rent moratorium decreed by the CDC is set to expire at year’s end with warnings of mass evictions while Congress dithers on providing aid. From Reuters: “The day after Christmas the extended unemployment benefits that have kept 12 million people and their families afloat are scheduled to expire. Then, mere days after that cliff on New Year’s Day, a national ban on renter evictions from the CDC is also set to lapse. Overnight, an unprecedented bill of $70 billion in unpaid back rent and utilities will come due, according to estimates by Moody’s Mark Zandi.” This, while Door Dash is valued at $38 billion, coincidentally the same size as today’s 10y auction.
Consumer warning
December 8, 2020
–Friday’s sell off in longer dated interest rate contracts was mostly erased yesterday. For example, TYH settled 137-21 on Thursday, 137-12 on Friday and back to 137-23 yesterday. EDZ3 went from 9947 Thursday to 42 on Friday and back to 46.5 yesterday. There was however, a new buyer of 30k 2EH 9950p for 1.5, settled there vs EDH3 9969.5. Overall activity was lackluster, apart from a lustrous move in gold, where GCG rose $26 to 1866 in a continuing reversal of late November’s sell off.
–There was a big miss in the Consumer Credit report. Revolving (credit card) debt in October fell at an annualized rate of 6.7%. Total consumer credit which includes non-revolving auto and student loan debt, still managed an increase of 2.1%. This report typically isn’t all that important, but it captured the month when a large portion of stimulus ended and coincided with many financial institutions tightening limits on credit cards. According to the St Louis Fed website, the delinquency rate on credit cards in Q3 was at a historic low of just 2%. That’s likely to move higher.
–Today brings NFIB small biz optimism, expected to pull back to 102.5 from 104 last. This data series correlates with Russell, which has been on a tear, so I wouldn’t be surprised to see a stronger than expected number. Final Q3 nonfarm productivity expected 4.9%. Treasury auctions $56b in three year notes today, followed by tens and thirties Wed and Thursday.
Uncapitalism
December 6, 2020 – Weekly comment
“Corporate bonds now yield less than inflation expectations for the first time in history” -Dec 2 Tweet from Otavio Costa
“You cannot have capitalism if you don’t have a hurdle rate for investment.” -Stanley Druckenmiller
There were two big themes in US interest rate futures trading this week. On the micro/regulatory side there was a change in guidance regarding the switch from LIBOR to SOFR. On the macro side, the curve powered to new highs for the year. Rather than plow through ARRC language on recommended fallbacks, I am just going to lightly summarize market reaction to the extension of libor to June 2023. With respect to the curve, I will attempt to touch upon the broader macro themes in the context of the quotes at the top of this note.
On Monday, November 30, the ICE Benchmark Admin and the Fed announced that 3-month libor will continue being published through June 2023. Rather than attempt to parse through the minutiae I will just note changes in spreads on the ED curve. From late September to early November, EDZ’21/EDH’22 calendar spread rallied from -1.0 to +7.0, as the end of 2021 was expected to trigger libor fallback provisions. Throughout that period, EDU’21/EDZ’21 stayed between 2 and 3.5, while EDH’22/EDM’22 traded between 0.5 and 2.0. I.e. the 3-month spreads surrounding Dec1/March1 barely moved; the market was clearly pricing a specific libor/sofr transition. With this week’s announcement that 3m libor would continue until June 2023, EDZ’21/EDH’22 instantly reverted to its former value of negative 1.0. Change on week +4.0 to -1.0. However, the extension to June’23 caused EDM’23/EDU’23 to explode higher, from +4.0 to +14.0 (settled 13.5). Again, the surrounding spreads were relatively quiet: EDH’23/EDM’23 has been between 2 and 5.5 since October, and EDU’23/EDZ’23 between 4.5 and 7.0. These calendar moves appear to be one-off adjustments. The Z1/H2 spread had rallied 8 (-1 to +7.0) and, as it reverted back, the M3/U3 jumped 10 (+4 to +14). Why the extra 2 bps? Because the first period is covered by the Fed promise to hold rates at zero, and out in 2023 that vow is much less certain; the general steepening of the curve is being increasingly reflected in deferred ED contracts.
In terms of curve steepening, all measures made new highs for the year: 2/10 ended the week up 12.5 bps at 81.5. This is interestingly exactly at the 0.618 retracement from the high of 135.5 made in late 2016 in the aftermath of Trump’s election victory, to the low of -5.3 set in August 2019. 5/30 ended the week at 131. This is much closer to the 2016 high of 139.5, and is right around the 0.382 retrace from the Nov 2010 high of 304 to the Aug 2019 low of 20. Next objective should be 160 to 165. On the euro$ curve, the red/gold pack spread (2nd year forward to 5th year forward) closed at 69.75. This spread too, had surged post-2016 election, from 40 in September to 101.5 in December’16. It had inverted at the low in 2018 to -5.6 as the Fed pursued its ‘normalization’ quest. From a longer term perspective, at the very end of 2013 red/gold had traded above 300 bps, equaling the level of 5/30 at its high.
The Fed’s continued oath to keep rates at zero along with hints of an expansion of bond buying, coupled with the prospect of more fiscal stimulus is helping to push stocks up and the dollar down (DXY new low this week 90.80). It’s unsurprising that the yield curve would steepen in this environment: the Fed is doing all it can to generate inflation which detracts from the value of longer dated fixed income contracts. Consider the long term chart below showing proxies for inflationary expectations, the ten year tip breakeven and the five-yr five-yr forward inflation swap. Both are at new highs for the year at 191.5 and 229.5, and both within about 30 bps of 2018 highs, when FF were 1.50 to 2.0% and 10’s were 2.80 to 3.0%.
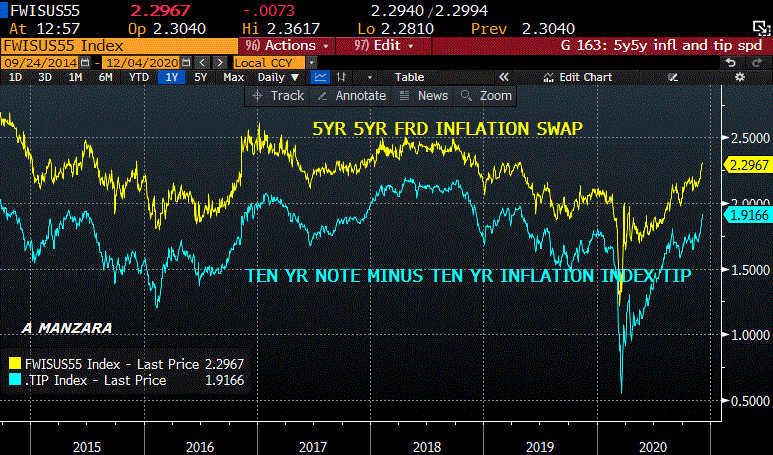
Now let’s consider the quote from the top of this note, that corporate bonds yield less than inflation expectations for the first time in history. What are the ramifications of THAT?! First, the author uses the ten year note to inflation indexed spread (shown above at 191.5) and then uses Barclays US Agg Corp Yield to Worst (LUACYW <index>) at 185.0. I checked the St Louis Fed (FRED) website for Moody’s Seasoned Aaa corp bond yield and it’s 221; the ICE BBB US Corp Index effective yield is 213.
No matter. If a company can borrow at a cost below inflation, and if inflation is expected to rise, causing all prices and inputs except interest rates to (theoretically) rise at the same rate, then there is a compelling argument to engage in financial engineering. A lot of it. There is no cap on asset prices. The investment “hurdle rate” is just a figment of Druckenmiller’s imagination. The underpinnings of capitalism are dissolved. Of course, this state of affairs doesn’t support the value of the US dollar because the “store of value” aspect of the currency is viewed with increasing suspicion.
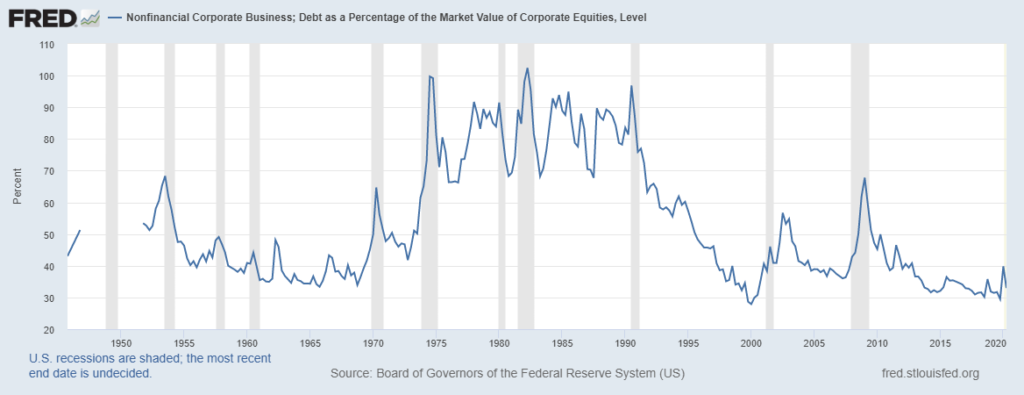
The Fed, of course, keeps warning about economic risks to the downside (and implicitly deflationary pressure) as it counsels for more fiscal stimulus. Companies have feasted on the gift of low funding rates as the market eyes forward inflation. However, the chart below shows that Nonfinancial Corporate Business debt as a percentage of the market value of corporate equities is at the historically modest level of 33%. In my mind, given that investment grade debt is mostly rated BBB, this level is more suggestive of overvalued equities than low healthy debt levels that would allow for productive expansion. As a percentage of GDP, corporate debt is at a record high. However there’s an alluring siren call to borrow given lofty equity prices. It’s all good. Until it comes time to roll the debt over.
On the government side, debt expands relentlessly. According to Beth Stanton at BBG, this week’s treasury auctions include $56 billion 3’s, $38b 10’s and $24b 30’s (last two are re-openings).
This Thursday’s CPI report probably won’t indicate price pressures. Core yoy expected +1.6, same as last. Fed’s Z.1 report is also released Thursday.
OTHER MARKET THOUGHTS/ TRADES
This week featured a large option roll in Blue March midcurves. Buyer of over 100k 3EH 9925/9912 put spread vs sell 3EH 9962/9975 call spread for 1.5 ref EDH’24 9946.0. The original trade from mid-Oct was buying 3EH 9912/9900ps vs 9975/9987cs for 0.25 to 0.5. Versus Friday’s settle of 9936.0 in EDH’24, the 9925/9900ps settled 4.5 and the 9962/9987cs settled 1.0. The top strike of the put spread is now just 11 bps away, and the trade has been helped by the libor extension and steeper curve. The US ten year note ended the week at 96.6; the 1% yield level is viewed as psychological resistance.
Because of the libor extension, contracts from EDU’23 back broke hard in relation to contracts just in front. For example, EDM2/EDM3 settled 13.0, up 3 on the week, while EDU2/EDU3 settled 24.5, up 12 on the week. The green/blue pack spread (Z2, H3, M3, U3 vs Z3, H4, M4. U4) is now the highest one-year spread area on the ED curve at 28.25 bps. Red/green is 13.75 and blue/gold is 27.75. The peak one-year calendar is EDM3/EDM4 which settled 32, just a little bit greater than one 25 bp fed hike.
On the treasury curve, there has been a decent amount of open interest build in Feb 136 and 136.5 puts which now comprise the largest open interest in Feb options at 67k and 63k. Some of these buys were rolls from higher Jan put strikes. Feb options expire Jan 22, just two days after the inauguration. With TYH1 having settled 137-12, the 136.5 strike represents a cash yield of around 1.06% given a parallel shift. The Jan 137p still has 108k of OI, the largest of any TY put option. It settled 17/64 and expires 24-Dec. Cash equivalent is just above 1% with breakeven around 1.05%.
December midcurves expire Friday. For the first time in a while, the Blue expiring midcurve straddle was mispriced. At the start of the week it was 5.5 offer and on Friday the contract settled 9942.0 with the straddle 9.0.
| 11/27/2020 | 12/4/2020 | chg | ||
| UST 2Y | 15.2 | 15.1 | -0.1 | |
| UST 5Y | 36.7 | 42.1 | 5.4 | |
| UST 10Y | 84.1 | 96.6 | 12.5 | |
| UST 30Y | 157.4 | 172.9 | 15.5 | |
| GERM 2Y | -75.5 | -74.7 | 0.8 | |
| GERM 10Y | -58.8 | -54.7 | 4.1 | |
| JPN 30Y | 64.8 | 65.0 | 0.2 | |
| EURO$ H1/H2 | 7.5 | 3.5 | -4.0 | |
| EURO$ H2/H3 | 7.5 | 9.5 | 2.0 | |
| EURO$ H3/H4 | 18.5 | 30.5 | 12.0 | |
| EUR | 119.61 | 121.21 | 1.60 | |
| CRUDE (active) | 45.53 | 46.26 | 0.73 | |
| SPX | 3638.35 | 3699.12 | 60.77 | 1.7% |
| VIX | 20.84 | 20.79 | -0.05 | |
https://twitter.com/TaviCosta/status/1334340659591827467/photo/1
https://www.thewealthadvisor.com/article/stanley-druckenmiller-couldnt-have-been-more-wrong
https://www.newyorkfed.org/medialibrary/Microsites/arrc/files/2019/LIBOR_Fallback_Language_Summary
NFP today but USD weakness dominates
December 4, 2020
–Employment report today with NFP expected 460 to 480k. Yields at the long end declined going into this data, with tens down 3 bps to 91.8. Stocks continue to respond to stimulus being “within reach”, while the dollar made fresh lows yesterday. CNY new high this morning vs USD at 6.53. This morning copper is at a new high for the move with HGH1 at 3.52. Crude oil is also at a new high, CLF1 at 46.29, up 65 cents. Ten year note to tip breakeven notched another new high at 188.7. Trade balance is also released today.
–While many news articles suggest faltering economic growth, dollar weakness projects a global easing of financial conditions, supporting prices of economically sensitive commodities.
–Large trade over the past two sessions: Buyer of about 90k 3EH 9925/9912 put spread vs 9962/9975 call spread for 1.5. Settled 1.25 vs 9946. This trade represents a strike roll from the original position taken in mid-October: +9912/9900ps vs -9975/9987cs. Rolled the 9912p to higher strike and the 9975c to lower strike. Expiration is March 12, 2021.
–Interesting tweet below suggesting increased shipping costs from Shanghai:
https://twitter.com/Steen_Jakobsen/status/1334761362967437313
Cheap Insurance
December 3, 2020
–Yields continue to press higher with tens up 1.7 bps yesterday to 94.8. Curve steepened with both 2/10, at 78.4, and 5/30, at 128, with a couple bps of the year’s high. Red/gold euro$ pack spread added another 1.625 to close 64.875. This spread has been boosted by the libor extension announcement, as reds jumped on the delayed fallback provision. As 3-month libor is now expected to survive until June 2023, the three-month euro$ calendar that has come into play is EDM3/EDU3, which has surged from 4 to 9 bps in the past two days! The spread gained 1.5 yesterday.
–Ten year treasury to tip breakeven ended at 187 bps, a new high for the year. The dollar index broke below 91 this morning, Dec Euro future is holding above 1.21. China yuan remains near the strongest level of the year vs USD at 6.56.
–As mentioned, EDM3/U3 spread is reacting to the announcement that three month libor will continue through June’23. The market generally thinks the Fed will stick to its promise to hold rates near zero for 2 to 3 years. What I find somewhat surprising is that the EDU23 9950 straddle is settling at just 40 bps, with 1019 days until expiration. That’s a long time from now. EDU3 settled 9951.5. EDU3 9900 puts settled 7.0, 9925p 11.25. There was an interesting article about Mexico having entered a long term put trade on the average price of oil, which this year paid off to the tune of a couple of billion dollars, saving the country’s budget from a huge hole. Uncertainty with respect to the price of EDU3 has been illuminated by the libor announcement. But there’s also a curve aspect, a question of Fed policy, the status of USD as a reserve currency, the prospect of inflation. EDU3 options expire well after the next midterm elections. If anyone thinks an unexpected surge in rates could blow a hole in their portfolio or business model over the next 2 and 3/4 years, here’s a cheap hedge. THIS IS NOT A RECOMMENDATION, EVEN THOUGH IF YOU BUY THESE THE MOST YOU CAN POSSIBLY LOSE IS THE PREMIUM SPENT.

