
Ringing the bell
December 18, 2025
*********************
–Usually I feel like there are a lot of market forces that are nuanced. There’s a huge premium for thoughtful analysis that can weave diverse themes together. This isn’t that.
Yesterday CNBC put it this way ‘Oracle stock slid after a report that Blue Owl Capital won’t back a $10 billion data center for OpenAI.’ Bloomberg headline: ‘Oracle-Blue Owl Split Over Data Center Rattles Markets Banking on AI Boom’. In my mind, THAT’S ringing the bell near the top. I’m an armchair observer of the AI boom. But I do know that big tech companies used to be able to finance expansion through free cash flow. Now they are borrowing. The businesses have become capital intensive. There’s a groundswell of public opposition to huge data centers. I assume that the Blue Owl guys are smart, and I recently saw the CEO uncomfortably making the financial news rounds to defend the company’s financial acumen and strength. But what did he ACTUALLY DO? Pulled the plug on incremental investment. Now I respect the guy. “Be first, be smarter, or cheat…It’s a hell of a lot easier to just be first.” OWL is down 35% ytd. Surprisingly. ORCL is UP 7.5% ytd but down 40% from late Sept and down 5% yesterday. The AI boom has been the driver. It’s over.
–Related, TSLA made a new all-time high yesterday at 490, but had an outside reversal day, closing -4.6%. I can’t help myself. Bought puts. And if I am wrong? I get out on new highs.
–Waller said yesterday that funds are still 50-100 bps above neutral, and said the labor market is very soft. Little movement in rate futures with SOFR strip +0.5 to -2.0. Peak contract SFRZ6 unch’d at 9690.5. TYH6 down 0.5/32 to 112-16. TYH6 112.5^ down to 1’44 from 1’49 Tuesday. Cash ten yield anchored at 4.15%.
–News today includes ECB, Jobless Claims expected 225k, CPI yoy 3.1% and Core 3.0%. The new midpoint FF is 3.625%, I would say it’s a bit hard to argue that neutral is 100 lower given 3% inflation. Philly Fed was -1.7 last, expected to see a bounce.
The $64,000 question
December 17, 2025
*********************
–The $64,000 Question is an American game show broadcast in primetime on CBS-TV from 1955 to 1958, which became embroiled in the 1950s quiz show scandals.
Non-farm payrolls yesterday, 64,000. Reverse the digits and get the unemployment rate of 4.6%. Time for mimosas and holiday parties.
So, yields eased a bit and 5/30 added another bp to end at a new high 113. (3.693, -3.8 bps and 4.823, -2.8 bps). Tens ended at 4.149%, down 3.1, and just about 51 bps above the current Fed Effective Rate. Plenty of carry to advance the national priority of supporting financial institutions and loading up more gov’t debt.
–Today features comments by Waller and Williams, followed by a 20y auction.
–Implied vol crushed yesterday with TYH6 112.5^ settling 1’49 from 1’56, or 4.7 down from 4.9. Seems like they’ve set prices for December 29… if all else equal vol would be 5.2 on 29-Dec, sort of where it’s been. Feb Crude Oil CLG6 also crushed to a new low of just 55.13, but this morning it has bounced, erasing that move.
–Interesting post by Melody Wright re housing: “We got our first negative median list price YOY nationally” According to Median List Price Per FRED via Realtor.
.
Told by an idiot, full of sound and fury. Signifying nothing
December 16, 2025
*******************
–PAYROLL data today! Curve edged steeper in anticipation. New high for the year in 2/10 at 67.4 (3.506 and 4.18). 5/30 also gained 2.2 bps to 112. On the SOFR strip all back spreads made new highs. As an example, red to green pack spread is +21.625 (9681.125 & 9659.5). I have shifted to March as the lead contracts in the packs. Example, SFRH7/SFRH8 settled 19 (9687, +3.5 and 9668, +2.0). Note that ERH7/ERH8 euribor spread is 26.5 and SFIH7/H8 is 19.5. Positive forward curves indicate policy normalization in my opinion.
–With Powell having said that payroll data has probably been overstated by 60k per month, my assumption is that the market is already looking for a weak number. I.e. if it’s +40k the market will interpret it as -20k. Fair assumption? I’m not sure, but I think the outlier would be a much stronger payroll number.
–Interesting BBG article yesterday noted that Fannie and Freddie are retaining more mortgages on their books, possibly to try to influence mortgage rates lower.
–In early to mid November, there was a size buyer of TYF 113.5 and 114 calls covered. Equivalent straddle levels were 1’55 to 1’61. Total about 185k 113.5c and 175k 114c. Jan options expire 26-Dec, 113c have 144k open, settled 8. TYF 113.5c settled 4 with 254k open and 114c settle 2 with 263k open. The buyer traded in clips of 50k to 35k and appears to have adjusted strikes lower over time.
YESTERDAY, buyer 50k TYH6 113.5c for 031, 31 delta (^2’07 equiv). Likely the same buyer and likely a lot more behind.
–Heard a great line this morning:
“Music is liquid architecture and architecture is frozen music.”
Of course this is a business that’s more like Dr Seuss:
“They’ll dance with jingtinglers tied onto their heels.
They’ll blow their floofloovers. They’ll bang their tartookas.”
As the Grinch says, The one thing I hate, all the Noise, Noise, Noise, Noise!
Summary of previous TY covered call buys (I have NOT captured everything here)
TYF6 Covered Call buys
Nov 6, 2025 113.5c
+35k 0’27 vs 112-145
+50k 0’30 vs 112-180, 32d
+50k 0’32 vs 112-205, 33d
Straddle levels 1’57 to 1’55. On Friday, atm TYF6 113^ settled 1’42 and 113.5^ settled 1’50
Nov 10, 2025 113.5c
+50k 0’28 vs 112-15, 30d (^ 1’58)
Nov 11, 2025 114.0c
+50k 0’29 vs 112-305, 31d (^ 1’61)
+40k 0’29 vs 112-315, 30d (^ 1’59)
Nov 12, 2025 114.0c
+28k 0’27 vs 112-280, 29d (^1’62)
Nov 19,2025 114.0c
+50k 0’22 vs 112-245, 26d (^1’59)
Dec 16, 2025 TYH6 113.5c
+50k TYH6 113.5c 0’31 covered 112-115, 31d (^2’07)
Friday steepener
December 15, 2025
*********************
–Friday featured a new high in 2/10 for this calendar year just above 66 bps with 2y unch’d at 3.526 and 10y + 5 bps in yield to 4.192%. 5/30 made a new recent high at 111 (hi of the year is 123.6). Long-end contracts trade weak, but the re-introduction of Warsh as potential Fed Chair may have temporarily alleviated the worst fears of reckless Fed cuts.
–The SOFR strip also steepened. SFRH6 +1.0 to 9646.5, H7 -1.5 to 9683.5, H8 -3.5 to 9666, and H9 -4.5 to 9646.0. The peak contract on the strip is now SFRZ6 as forward contracts have sold off. SFRZ6 is now 9684.5. On settlement basis, it’s been in a tight range for five months, 9669 low in July to 9713.5 high in September just prior to the ease.
–Fed Effective setting on Thursday was 3.64 or a price of 9636.0. FFG6 captures the Jan 28 FOMC and settled 9642.0 or 3.58%, 20-25% chance of ease at that meeting. All FF contracts from Dec’26 thru Sept’27 are clustered at 9689 to 9690.5, consistent with a terminal target of 3.0-3.25.
–ADP and Employment report on Tuesday. NFP for Nov expected 50k with rate 4.5%.
–In 2007 the Fed eased in Sept by 50 from 5.25 to 4.75, then cut 25 at the end of October and at the Dec meeting. SPX made its high on 11-Oct-07, fell through November but had a last gasp bounce on Dec 11, which failed to approach the October high. CPI was 4.1% in Dec 2007. From the Dec’07 high to one year later low, the loss in SPX was just over 50%. Some similarities now, high on Oct 29, bounce to last week’s high on Dec 11, Fed eases. The difference of course: the current stable of sane economic stewards steering the train : – /
–A bit of quick math. $400k 30y mortgage at current 6.3% rate is $2476/mo. 50y mortgage same rate of 6.3% is $2195/mo. Difference is $281/mo or $3372/yr. Which just might be swallowed by local property tax and home insurance increases. If the 50y mortgage rate were 7.2%, the monthly payment would be $2468/mo.1984
For What It’s Worth
December 14, 2025
*********************
There’s something happening here
What it is ain’t exactly clear
There’s a man with a gun over there
A-telling me I got to beware
-Buffalo Springfield – For What It’s Worth
This song keeps running through my mind, originally released in 1966, a protest ballad of the day which rings true right now.
There’s battle lines being drawn/Nobody’s right if everybody’s wrong
Luke Gromen was on Jack Farley’s podcast last week, Monetary Matters. Gromen’s thesis: the US needs to build out massive infrastructure (refineries, electrical grid, industrial capacity) to compete with China in both AI and military spheres. It takes time and resources. China has already done the groundwork and continues to secure critical supplies. Gromen sees the choices for the US as either: sacrifice the bond market and the USD (reshore manufacturing and supply chains) or move back to the model of letting China dominate manufacture of industrial goods, rare earths, and AI. Yield curve control and inflation are likely outcomes.
I’m not sure I agree or even completely appreciate his logic. But here’s what I do know. Bond yields are pointing up on the chart. I try to trade with the trend.
In mid-2004, the Fed starting raising rates in 25 bp increments at every FOMC. Just before rate hikes actually began, the 10y yield was 4.85% and the 30y was 5.50%. On February 16, 2005, after the Fed had already raised FFs from 1.0% to 2.5%, Greenspan made his famous “conundrum” comment, “For the moment, the broadly unanticipated behavior of world bond markets remains a conundrum.” Bond yields/forward rates had actually FALLEN, and by early Feb the 10y was 4.15% or about 70 bps lower than pre-hike and the 30y was 4.55%, nearly 100 lower. In fact, by the end of the hike cycle in mid-2006, FFs, 10s and 30s were ALL 5.25%.
Before I get to today’s bond market dynamics, here’s another interesting clip from Greenspan’s speech:
More broadly, rising home prices along with higher equity prices have outpaced the rise in household, largely mortgage, debt and have pushed up household net worth to about 5-1/2 times disposable income by the end of last year. Although the ratio of net worth to income is well below the peak attained in 1999, it remains above the long-term historical average.
Here’s a link to St Louis Fed’s chart on Net Worth/Disposable Personal Income. It shows 1990 NW/DPI around 520%, early 2005 at 650% and now at a near-record 782%.
https://fred.stlouisfed.org/series/HNONWPDPI
In any case, today’s conundrum is quite the opposite. The Fed has been CUTTING rates and long-end yields have gone UP, as the chart below shows. In late 2023 after the rate hike cycle ended with FFs 5.375% mid, the 10y peaked at 4.99 and the 30y 5.11. Just prior to the first cut in September 2024, the 10y yield was 3.62 and the 30y 3.93. Now, after 175 bps of FF easing, the 10y is 57 bps higher at 4.19 and the 30y is 93 higher at 4.86.
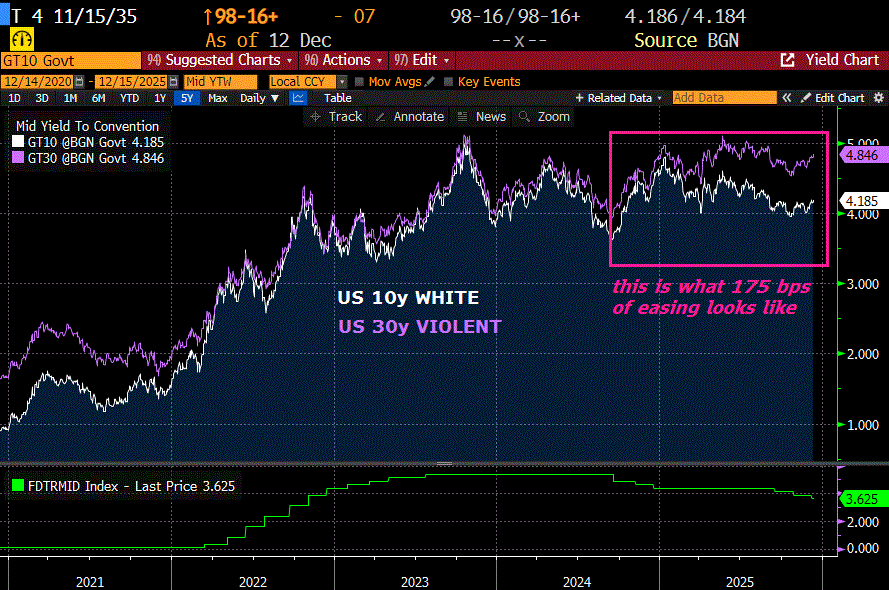
Something’s happening here. What it is ain’t exactly clear. But it sure looks like a combination of inflation fears and a jump in term premium. A Trumpian Fed Chair that cuts rates further is only likely to exacerbate the issue.
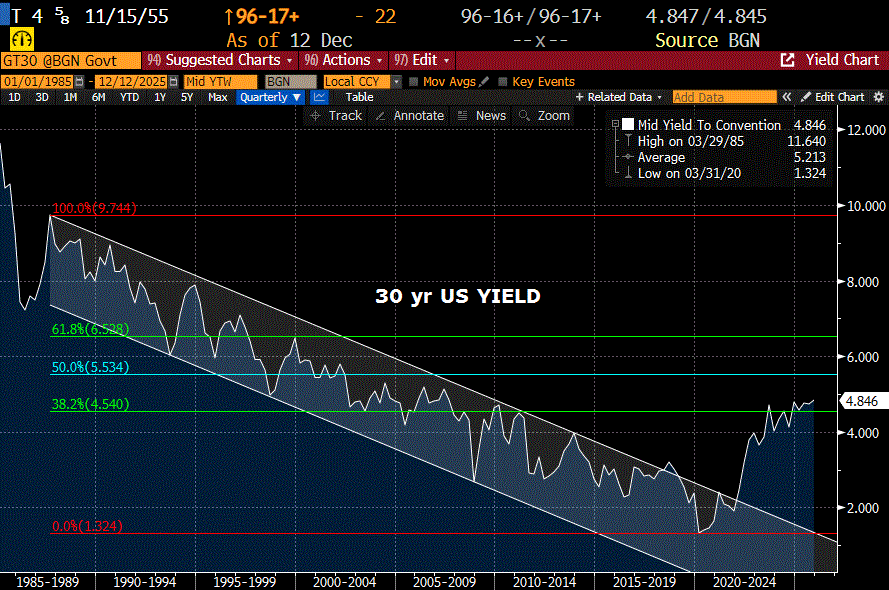
I would define the modern downward bond yield channel as starting in 1987 at 9.75% and ending in 2020 at 1.32%. The halfway mark is 5.53, around levels from 25 years ago in 2001. It sounds far away but looks completely reasonable on the chart.
While inflation could edge lower as shelter costs ease, supply chain pressures will likely keep a floor under disinflationary impulses. The risk to a forecast of higher bond yields may be deflating equities. However, given wealth effects and potentially lower capital gains revenue, the market may perceive that weaker equities lead to US budget strains with more supply/deficits.
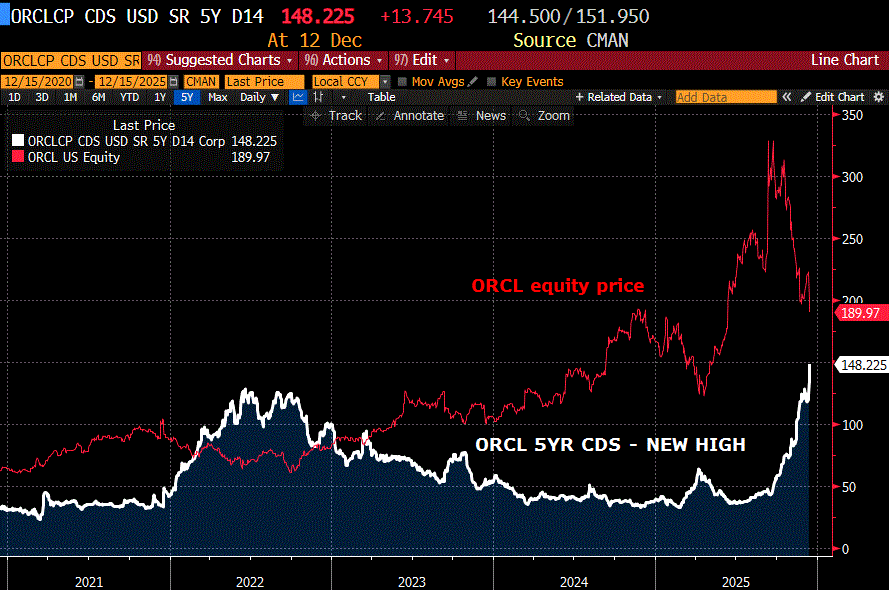
This note is a bit long so I will save other topics for later, but I am adding a chart of Oracle stock and CDS price. My thesis is that the US public was generally united in the goal of winning the Space Race. After that, the goal of winning the Cold War and even the War on Terror had broad support at the time. I’m not so sure the public sees winning AI as a laudable national objective.
OTHER THOUGHTS/ TRADES
ADP and Nov payrolls are released on Tuesday. NFP expected 50k and Unemp Rate 4.5%. Recall that during the FOMC press conference Powell said payrolls might be overstated by as much as 60k per month [due to birth/death model]. The market is probably already leaning for weak data. What if it’s stronger than expected? Side note, StoneX’s Vincent Deluard says that US income tax collections are running at an 8 to 10% growth rate (nominal) over the past year.
BOJ meeting at end of week, with 10y JGB pinned near the high at 194.6% and the 20y at 2.905%. US issues $13b 20-yr on Wednesday. Current yield 4.81.
This week US 2/10 spread ended at a new high 66 bps. Last time it was here was Jan 2022, prior to the start of the rate hike cycle. High in 2021 was 157, but that was with FF at 0-0.25. US 5/30 ended 111 bps vs a high this year of 124 in Sept.
Chart below is US 30y yield in green and US bond vol in white. MOVE looks similar but the real focus should be on the possible breakout of the long-end yield and US puts. MOVE weighting is 20% for 2y, 5y and 30y and 40% 10y.
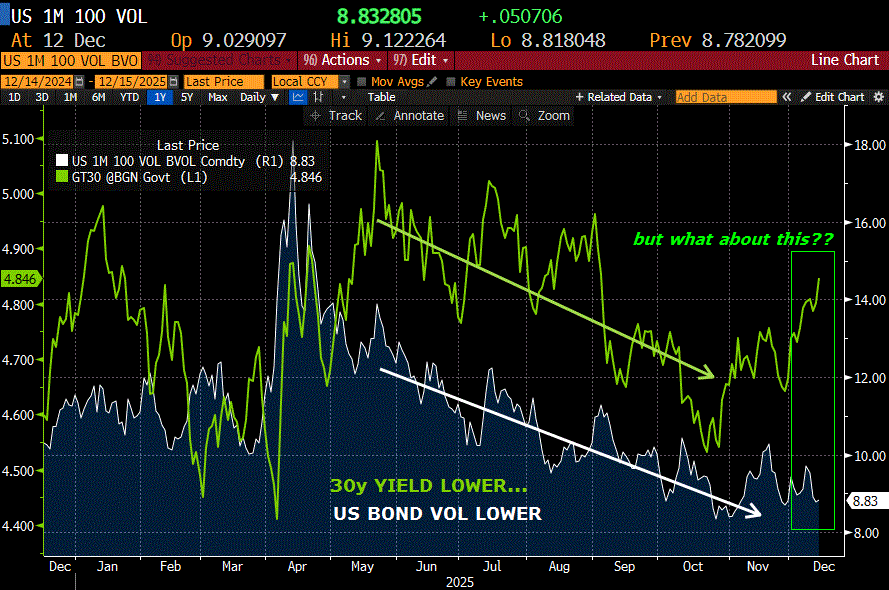
This chart is begging for bond vol to be bought.
According to BBG CMS screen, it’s still the case that a rise in USH contract of 50 bps (estimated at 108-17) will result in a longer duration Cheapest-to-deliver. Current CTD is 4.75 of 11/43, with a DV01 of $119.5. With a conversion factor of 0.8657 that makes DV01 on the contract $138. But a shift of 50 bps higher would make 3.625 of 2/44 cheapest, DV01 108.90, factor 0.7427, contract DV01 $146. It appears the market is underpricing otm bond puts.
| 12/5/2025 | 12/12/2025 | chg | ||
| UST 2Y | 356.2 | 352.6 | -3.6 | |
| UST 5Y | 371.5 | 374.7 | 3.2 | |
| UST 10Y | 413.7 | 419.2 | 5.5 | |
| UST 30Y | 479.1 | 485.7 | 6.6 | |
| GERM 2Y | 209.3 | 215.2 | 5.9 | |
| GERM 10Y | 279.7 | 285.6 | 5.9 | |
| JPN 20Y | 291.1 | 290.6 | -0.5 | |
| CHINA 10Y | 183.1 | 183.7 | 0.6 | |
| SOFR H6/H7 | -43.0 | -37.0 | 6.0 | |
| SOFR H7/H8 | 13.5 | 17.5 | 4.0 | |
| SOFR H8/H9 | 18.5 | 20.0 | 1.5 | |
| EUR | 116.42 | 117.42 | 1.00 | |
| CRUDE (CLG6) | 59.78 | 57.24 | -2.54 | |
| SPX | 6870.40 | 6827.41 | -42.99 | -0.6% |
| VIX | 15.41 | 15.74 | 0.33 | |
| MOVE | 67.28 | 69.25 | 1.97 | |
In: Eurodollar Options
Don’t forget the ‘Industrials’
December 12, 2025
*********************
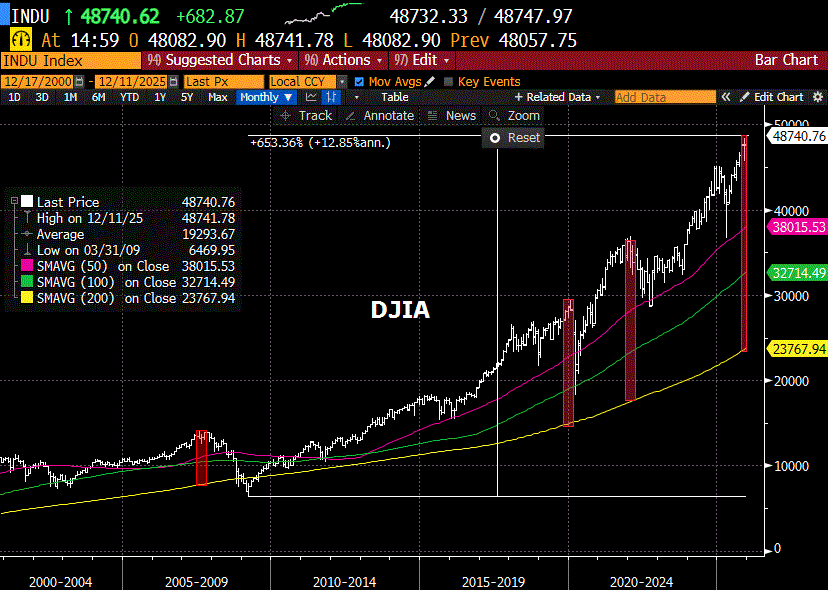
–The attached chart that’s going vertical? Nope, not silver. It’s the Dow Jones Industrial Avg. Record close 48704. Since the low in 2009 it’s up 7.5x. It’s also near a record gap to the 200 month moving average (now 105% above the 200 MA). In Dec 2021 the price was 109% of 200ma prior to the pullback associated with Fed hiking.
–Yields pressed lower in the wake of the FOMC. Peak SOFR contracts are SFRZ6 and H7 now tied at 9685.0 (+4.0 and +5.0 net chg). For some time, SFRH7 has been the peak contract. In early Sept, a couple of weeks prior to the Sept 17 ease, the high print was 9719.5. H7 pulled back post-Fed to around the current level and then in mid-Oct, again a couple of weeks prior to the Oct 29 ease, rallied to 9717. So, this contract is now about 30 bps lower than it was in September, even after the Fed has cut 75 bps. Clear change in sentiment, which is also reflected in 10s: down 2 bps to 4.139% yesterday, but still 20 bps higher in yield than the mid-Oct low.
–Star performers were SFRM7, U7, Z7, all up 5.5 to 9683, 9679.5, 9675. These contracts all had curious new deep-in-the-money call buying:
SFRM7 9650c +56.5 (55.0s, OI +8.3k)
SFRU7 9650c +58.5 (57.0s, OI +5.9k)
SFRZ7 9650c +60.0 (57.75s, OI +10.7k)
SFRH8 9637c +67.5 (65.25s, OI +9.6k) Breakevens on all are just above the 9700 (3%) strike.
In conjunction with these trades, 2/10 treasury spread edged to a slight new high, 61.3 bps, near the peak of this calendar year, which I have marked at 66 bps.
–ORCL continues to act like a big canary, down 11% yesterday. This morning, it’s Broadcom (AVGO) which popped post-earnings, but is called 6% lower now. In China, property developer Vanke is trying to restructure debts with BBG saying it has now lost state support.
–Speaking of state support, DonMiami3 notes in an X-post that discount window borrowing has hit a new high for 2025. Trivial amount compared to the SVB fallout and Covid prior to that, but still worth a footnote.
https://x.com/DonMiami3/status/1999376804381868402/photo/1
In sync
December 11, 2025
*********************
–Fed cut to 3.5-3.75% and is buying $40b t-bills to alleviate pressure on reserves going into tax season. Powell deems the new FF target as being at the upper end of neutral and was generally optimistic about inflation trending lower, saying that service inflation is easing and that goods inflation at present is mostly due to tariffs (likely to recede). He also said that NFP may be overstated by as much as 60k per month, so against a recent average of +40k that may mean payrolls have been running -20k. Three dissents: Schmid and Goolsbee wanted no ease and of course Miran favored a 50 bp cut.
–Some fairly interesting projections: just looking at 2026, GDP growth estimate revised up to 2.3% from 1.8% in Sept and PCE inflation down to 2.4% from 2.6 in Sept. FF projected to be cut only once more in 2026 to 3.4%. The implication is an improvement in productivity, with some asking whether that was due to AI, open question.
–Market response was overall muted. Curves steepened. On the SOFR strip, SFRM6 and U6 were leaders, both +4.5 at 9663.5 and 9677.0. There was a huge new buyer of U6 prior to the FOMC in size of about 100k from 9675 to 9677, with open interest gaining 82k. Deferred SOFR contracts were barely changed. SFRM6 was +4.5, SFRM7 +2 at 9677.5, M8 and M9 unch’d at 9659.5 and 9642.5. In treasuries, 2/10 edged to a new high just above 60 bps (3.557%, down 5.4 bps and 4.159% down 2.9 bps).
–It will take a few sessions to see how things shake out. As Powell said, there will be a lot of data before the Jan FOMC. Against a new Fed Effective of 3.64%, FFG6 settled 9641 or 3.59%. The next FOMC is 28-Jan, so the Feb contract projects about 20% odds of another ease. SFRZ6 settled 9681.0, up 3.5 on the day. This contract is now peak on the strip, moving up a slot from H7. So Dec’26 has a rate of 3.19% vs SEP projection of 3.4% for year-end 2026. Not a particularly wide spread. In fact, across the interest rate spectrum, despite all the hand-wringing about a divided Fed and uncertainty, yesterday’s closing prices were pretty much in sync with the Powell’s comments. The amount of projected forward easing has been pared back in terms of market pricing, and implied vol in rates is now at the low end of recent ranges. The interesting spread is 10s vs overnight funding. if EFFR is now 3.64 and SOFR somewhere around 3.7, the 10y at 4.16 is around 50 bps over. I’d bet Bessent wants this spread much tighter. 30y auction today.
–The ever-present risk is financial conditions/stability, sometimes thought of as the Fed’s third mandate. Small reminder with ORCL results post-close. This morning ORCL is down around 11%. NQH6 currently down 200 or nearly -0.8%.
FOMC / Sentiment shift regarding future cuts
December 10, 2025
********************
–FOMC today. Fairly quiet session which featured a solid 10y auction, but rate futures settled at the low end of ranges. The treasury curve was flatter with 2s +3.2 bps to 3.611% and 10s +1.6 to 4.184%. 30y bond actually eased slightly in yield; USH contract +3 to 115-06 and WNH +5 to 118-11.
–On SOFR strip, SFRH6 -3 to 9640, H7 -4.5 to 9677.5, H8 -4 to 9664 and H9 -3 to 9646.5. Near calendars made new highs as red contracts lead to the downside. SFRH6/H7 is -37.5. up exactly 20 from a settle of -57.5 on 25-Nov. More on that below.
–Silver was the star performer, exploding to a new high. SIH6 settled 60.84. +2.43 and last print is 61.40 this morning. The gold/silver ratio has absolutely plunged. Chart will follow later today.
–There’s plenty of chatter about whether today’s FOMC will be a dovish or hawkish cut. In the medium term, I don’t know how much that matters. We’ll be getting a new Fed composition, likely with a wider array of pressures (unemp & inflation both pushing higher, and Trump flailing against both).
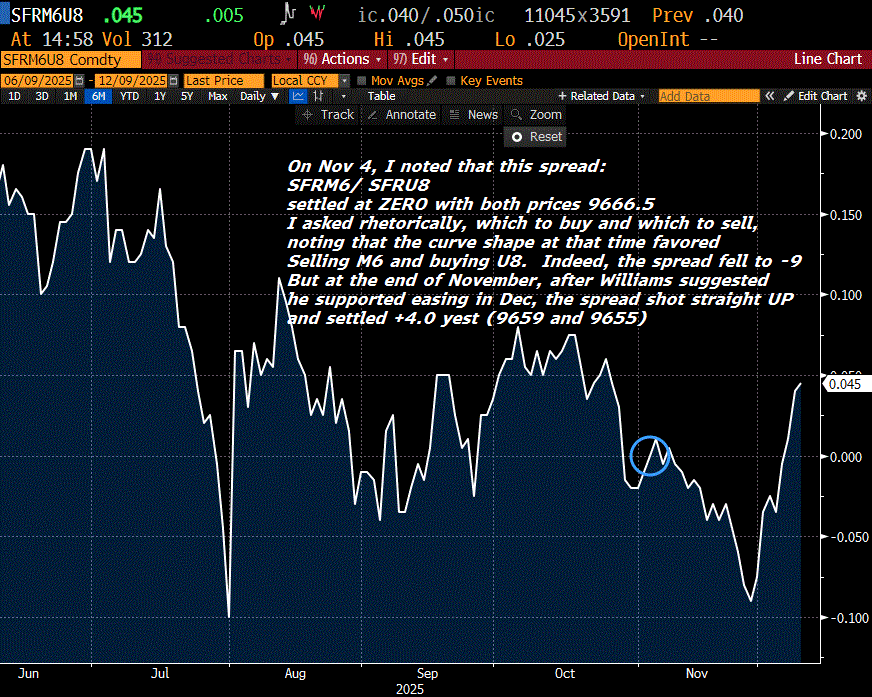
–I find the attached chart interesting. On Nov 4, I noted that calendar spread SFRM6 and SFRU8 settled zero. Both contracts were the same price, 9666.5. I asked rhetorically, which to buy and which to sell, nothing that the shape of the curve favored selling M6 and buying U8, just playing the roll. Indeed, the spread fell to -9 on Nov 26, 9671 & 9680. However, that marked the bottom and from there the spread (like other SOFR calendars) went straight up. Yesterday, SFRM6 settled 9659 and SFRU8 9655 for a spread of +4.
In the context of today’s FOMC, I would say that something happened at the end of November to change the psychology of FORWARD easing. What was the exact catalyst? On Nov 21, NY Fed’s Williams said he saw room for further adjustment (ease) and the market instantly pivoted from a hold at this Dec FOMC to a probable cut. Then Daly came out a couple of days later and said that she favored an ease (a signal directly from Powell, in my opinion). On Nov 25 Hassett emerged as front-runner for the Fed chair. On Wednesday, Nov 26, there was a buyer of over 50k SFRH6/SFRM6 spreads at -25.5 to -25.0. That was the shift, RIGHT THERE. That spread is now -19.0.
So what’s the point of this little exercise? I don’t much care what the famous analysts are saying about hawkish or dovish cuts. The market is saying that forward cuts are being priced out, not completely, but to a large extent. Money has committed to the idea. Might be right, might be wrong, but I’ll take the market clues over sideline prognosticators and forecast that 1) there are renewed concerns about inflation perking up and 2) there could be some sugar growth. Is silver also telling us that?
Cracks beneath the surface
December 9, 2025
*******************
–Apart from very front contracts, yields continued to press higher. In front of today’s ten-year auction, the yield rose 3.1 bps to 4.188%. 30s closed 4.183%, up 2.2 bps. Although the financial press is trying to manufacture a bit of drama around tomorrow’s FOMC, front contracts are priced near certainty of an ease, and have been for several sessions. FFF6 settled +0.5 at 9635.0 or 3.65 vs EFFR of 3.89. SFRZ5 and H6 both were unch’d at 9626.75 and 9643 respectively. However, H7 (peak contract) settled -4 at 9682 and H8 & H9 were -4.5 at 9668 and 9649.5. All near one-year SOFR calendars made new highs as deferred contracts pressed lower. For example, SFRH6/H7 settled -39, +4 on the day. Recall that with Sept’25 contract as the front (prior to the last two eases) U5/U6 was more like -108 to -100. Which makes sense….Z5/Z6 is now -54.75 and 2 eases have occurred. The point is that FORWARD easing assumptions are being squeezed out of the equation.
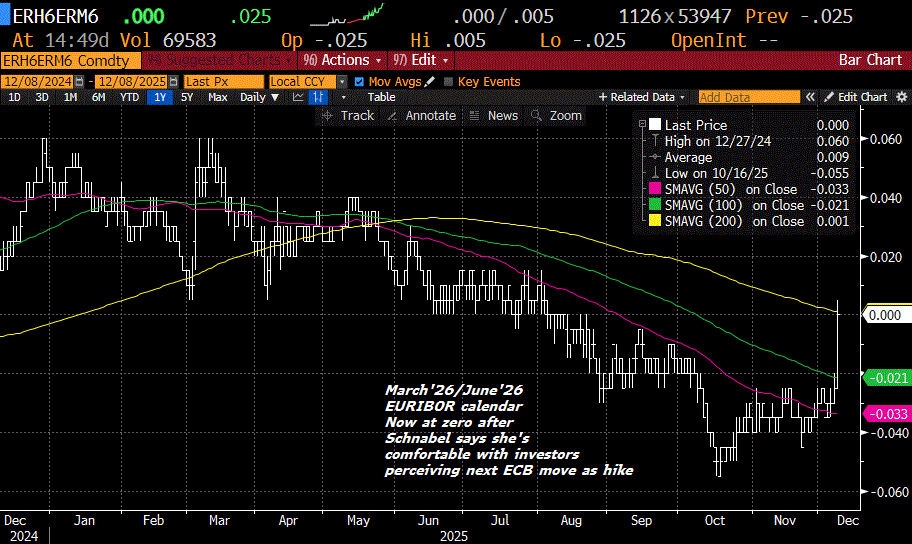
–That’s evident in Europe with the attached ERH6/ERM6 spread. Schnabel said yesterday morning that she was comfortable with the next ECB move being a hike, and the March/June 3-month euribor spread went from -3 to zero. The perception of central bank largesse going forward is changing. On the US side, the main question that needs to be addressed by Powell is when the T-bill buying starts, in order to expand reserves and alleviate tightness. So….maybe there WILL be a little drama at the Fed’s press conference.
–On an average day, there are about 50 small earthquakes on the US Geological Survey map. Yesterday there were 100. The world is literally tearing apart! Just kidding, but northern Japan had a big one yesterday, of 7.6 with continuing large aftershocks.
https://earthquake.usgs.gov/earthquakes/map/?extent=-39.23225,-259.80469&extent=70.08056,-37.08984
In the old days bonds used to be sold after disasters, because insurance companies would have to sell assets to raise money to pay claims. Now that chain seems a bit more diffuse, but it’s reasonable to think that perhaps Japan isn’t as likely to support 10s and 30s at the auctions. Just a thought.
–The huge covered call buyer of TYF 113.5 and 114 calls is adjusting, rolling down strikes. For example, a buyer of 30k TYF 112.75/113.5cs for 11. Also bought 113/113.5cs.
Settles:
TYF6 112.75/113.5cs 18 and 7, so 11 vs 112-08
TYF6 113.00/113.5cs 13 and 7 so 6.
Open interest up 32k in each of the lower strikes and -74k in the 113.5 strike.
–ZH reports the CFTC is starting pilot programs to allow Bitcoin and Ether as collateral. (Maybe the financial world WILL literally tear apart…)
Some prices go down
December 8, 2025
*******************
–Despite early block trade buys of 90k FVH6 ~109-11+ and 80k TYH6 112-23+ on Friday, futures closed lower. FVH6 settle 109-07+ and TYH6 112-16+. FV buys appear new with prelim OI +47k and TY exit with OI -35k. Ten year yield up 2.7 bps on the day to 4.137%. Three year auction today, followed by 10s Tuesday and 30s on Thursday, with FOMC decision on Wednesday.
–New recent highs in some of the near SOFR calendars. For example, SFRH6/M6 settled -21 (9643, -2 & 9664, -3). These two contracts bracket the end of Powell’s term as Fed Chair. While the inversion still suggests easing bias, some had originally thought this spread could move to -40 or more, on the idea that a new Trumpian Fed Chair would instantly slash rates. Interestingly, ECB Board member Isabel Schnabel today said she’s comfortable with investor bets that the ECB’s next move will be an increase (BBG).
–Frank Sinatra’s classic song Chicago features these lyrics, “On State Street, that great street…”
That was then. Perry Laufenberg reports on LinkedIn, an office building at 401 South State, across from the Chicago Public Library, sold for $66 million in 2016 and just $4.2 million in October of this year!
Oct 2025 Sales Price: $4.2 million ($8.75 per SF) 👀
2016 Sales Price: $66 million
Another historic office building in Chicago’s Loop has changed hands at a price that shows just how far distressed assets can fall. The landmark property at 401 S. State Street, originally built in 1891 by architect William Le Baron Jenney, was sold at auction for just $4.2 million… a 94% discount from the previous sale.
Vacant since Robert Morris University moved out in 2020, the building sat in financial limbo for years, controlled by a CMBS lender after the previous owner defaulted.
What comes next is still unclear, but the buyer’s involvement in a nearby 400-unit office-to-residential conversion hints at the direction. The Clark Adams Building project, backed by nearly $68 million in public funds, is part of a broader push to bring affordable housing into the urban core.
With its full-block footprint and historic designation, 401 S. State offers strong potential for a creative, mixed-use future.

