
Stand and De-lever
December 7, 2025 – Weekly comment
****************************************
This week BOE warned about the basis trade in gilts. The Fed has also been monitoring basis trades. On 4-Dec, the US Office of Financial Research released a report ‘Sizing the US Repo Market’. “According to new data collected by the OFR, the U.S. repurchase agreement (repo) market averaged about $12.6 trillion in daily exposures in Q3 2025, a number that is about $700 billion larger than previous estimates.” Of the $12.6T, non-centrally cleared bilateral repo (NCCBR) accounted for $5T. “In Q3 2025, U.S. Treasuries collateralized 88.9% of exposures in the cleared repo segments, but only 61.8% of NCCBR exposures and just over half (52.6%) of the exposures in tri-party.”
I have no idea if this is related, but Friday morning featured a flurry of Treasury futures buys on block trades. The lines I highlighted indicate 90k ($9b) FVH6 bought 109-11 to 109-1175 and 80k TYH6 bought 112-225 to 112-240. FVH6 settled 109-075 and TYH6 at 112-165. Prelim open interest in FV +47k and in TY FELL 35k (consistent with short covers in TY).
| 09:05:45 AM | Future | 5-Year T-Note Futures | ZFH6 | 109’110 | 45,000 | 109’110 | ||
| 08:47:05 AM | Future | 10-Year T-Note Futures | ZNH6 | 112’235 | 10,000 | 112’235 | ||
| 08:41:01 AM | Future | 5-Year T-Note Futures | ZFH6 | 109’117 | 25,000 | 109’117 | ||
| 08:32:02 AM | Future | 5-Year Eris SOFR Swap Futures | YIWZ25 | 101.65 | 447 | 101.65 | ||
| 08:21:35 AM | Future | 5-Year T-Note Futures | ZFH6 | 109’135 | 7,000 | 109’135 | ||
| 08:13:43 AM | Future | 10-Year T-Note Futures | ZNH6 | 112’240 | 20,000 | 112’240 | ||
| 07:59:31 AM | Future | 10-Year Eris SOFR Swap Futures | YIYH26 | 102.32 | 20,000 | 102.32 | ||
| 07:40:14 AM | Future | 5-Year T-Note Futures | ZFH6 | 109’110 | 20,000 | 109’110 | ||
| 07:32:34 AM | Future | 5-Year T-Note Futures | ZFH6 | 109’110 | 5,000 | 109’110 | ||
| 07:31:43 AM | Future | 10-Year T-Note Futures | ZNH6 | 112’225 | 25,000 | 112’225 | ||
| 07:28:41 AM | Future | 10-Year T-Note Futures | ZNH6 | 112’235 | 25,000 | 112’235 |
Quick thought about official monitoring of trades that could possibly shatter markets. There was a guy named Zeets who was part-time clerking for his brother on the CME floor while training to become a high-school teacher. One of his assignments was to be a classroom observer. He said between classes a fight broke out in the hallway. Dave, who I worked with, asked “What did you do?!” Zeets, “I observed.”
It’s one thing to identify a potential problem. It’s another to intervene. Especially when the trade is a pillar of demand for US Treasury supply.
I had thought TY buys were gamma related, as there had been huge covered-call buys in TYF 113.5c and 114c early to mid-November. If there hadn’t been adjustments in the meantime, there would easily be 80k short futures to cover, leaving residual long calls. That idea doesn’t account for FV buys. In any case, even with this significant buying, contracts settled lower. And that’s going into a Fed meeting which is highly likely to result in a 25 bp cut. On the week, US 5y yield rose 11.9 to 3.715% and 10s rose 12.4 bps to 4.137%. The 10y bund rose 10.9 to 2.797% and JGB +13.3 to 1.939%. Strong employment figures caused a jump of 27 bps in Canada’s 10y, up to 3.414%!
Below is a chart showing March ’27 contracts of STIR contracts: Euribor in gold, Corra in red, SFR in white and Sonia in blue. Vertical violet lines are Fed cut dates. Euribor new low since April.
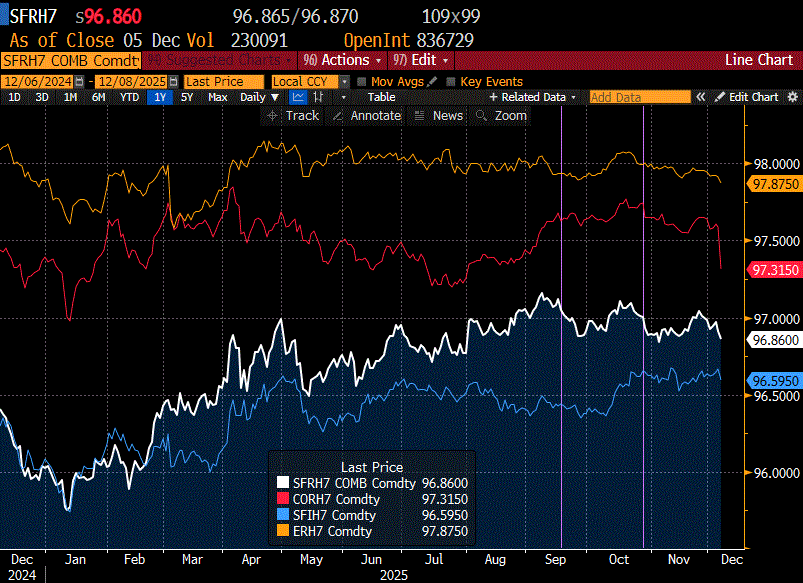
Like global 10y yields, forward STIR rates are moving higher.
I have been tracking SFRH7 as it has been the peak SOFR contract for quite some time, and might be loosely framed as the expected ‘terminal rate’ for Fed policy. The Fed eased on Sept 17 and H7 settled 9705. The week prior on 10-Sept it was 9712.5 (expecting the ease). The week after on 24-Sept it was 9696.0 (buy the rumor, sell the fact). The next Fed cut was Oct 29. SFRH7 settled 9693 that day. The week prior, on 22-Oct it was 9709.5 and the week after on 5-Nov it was 9684.0 (buy the rumor sell the fact). On 3-Dec, a week prior to this week’s FOMC, SFRH7 was 9697, and it settled Friday at 9686.
Since early August, SFRH7 has settled between 9716 and 9684, 16 bps on either side of 3%, and that’s with 50 bps of ACTUAL ease and another 25 expected on Wednesday. I suspect the market is NOT taking down the terminal rate because the bonds won’t accept it; bond yields may shoot higher. It feels an awful lot like concerns of a renewed inflation jolt might take hold.
Below is a chart of the US 10y yield in white, with the yield on constant second red SOFR contract in red (currently SFRH7). Again, violet verticals are Fed cut dates.
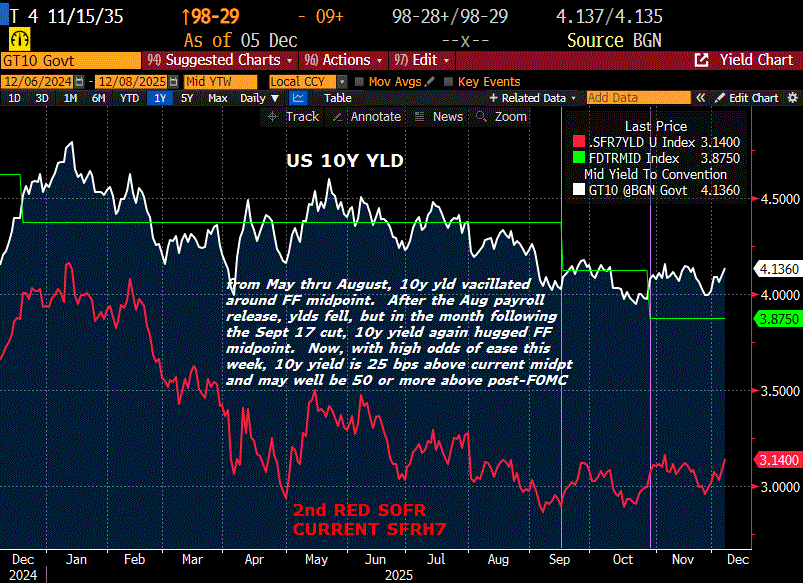
FOMC is Wednesday. Treasury auctions of 3s, 10s and 30s Monday, Tuesday and Thursday. On Friday, Q3 Household Net Worth (Fed’s quarterly Z.1 report) will be released. SPX gained 7.8% in Q3, so I’m sure net worth will be at a new high. In the five years from Q2 2020 to Q2 2025, HH Net Worth went from $111.729T to $167.260T, an astonishing gain of 50%. (St Louis Fed). I’m not so sure new highs in HH Net Worth will be trumpeted quite as loudly by mainstream press this time. The rich getting richer isn’t a narrative the average family finds helpful.
| 11/28/2025 | 12/5/2025 | chg | ||
| UST 2Y | 348.9 | 356.2 | 7.3 | |
| UST 5Y | 359.6 | 371.5 | 11.9 | |
| UST 10Y | 401.3 | 413.7 | 12.4 | |
| UST 30Y | 466.3 | 479.1 | 12.8 | |
| GERM 2Y | 202.6 | 209.3 | 6.7 | |
| GERM 10Y | 268.8 | 279.7 | 10.9 | |
| JPN 20Y | 282.8 | 291.1 | 8.3 | |
| CHINA 10Y | 183.0 | 183.1 | 0.1 | |
| SOFR Z5/Z6 | -68.8 | -58.3 | 10.5 | |
| SOFR Z6/Z7 | 4.0 | 7.5 | 3.5 | |
| SOFR Z7/Z8 | 19.5 | 19.0 | -0.5 | |
| EUR | 115.98 | 116.42 | 0.44 | |
| CRUDE (CLF6) | 58.55 | 60.08 | 1.53 | |
| SPX | 6849.09 | 6870.40 | 21.31 | 0.3% |
| VIX | 16.35 | 15.41 | -0.94 | |
| MOVE | 68.95 | 67.28 | -1.67 | |
Long end concerns
December 5, 2025
*******************
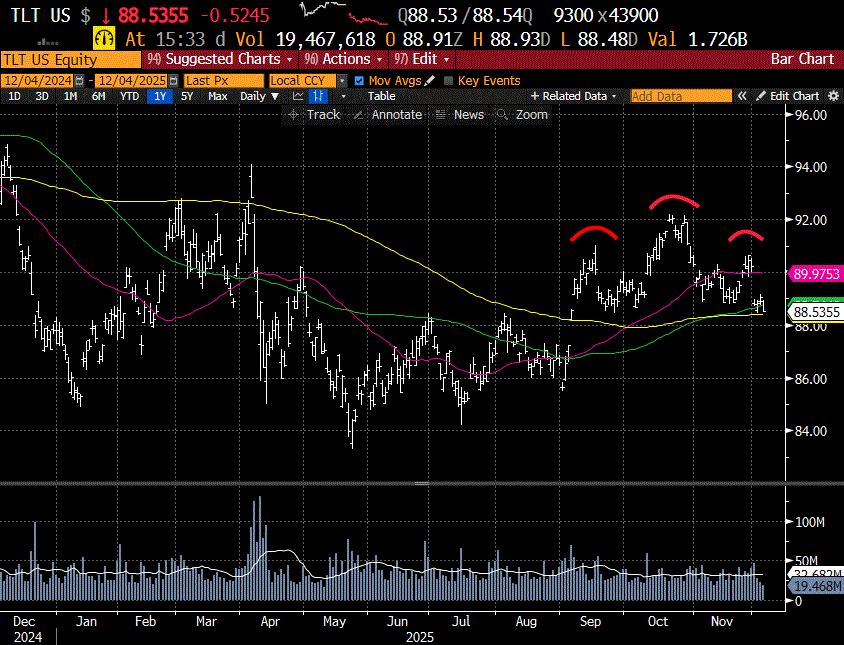
–Rate contracts now have very bearish chart set-ups. Quite clear on TLT chart…H&S top. Price 88.53, right at the 200DMA 88.41. A break below that projects to 84.50/84.60. Could get ugly quick. The only reasons I don’t have super-high conviction is that implied vol is being pressed lower (in TY), and volumes aren’t great. Below 88.40 I would expect those two factors to change.
–Though it wasn’t a particularly active session, there were a few themes: Call buying in SOFR. Steeper SOFR curve. Higher rates across the board.
–First, call buying in SOFR. For example, a buyer adding to longs in SFRH6 9662.5c through SFRH6 9662.5/9681.25 c 2×1, paying 8.25 to 8.5. SFRH6 9662.5c settled 5.25 with open interest up 55k. H6 9681.25c settled 2.75 (so pkg 7.75s).
–There were a couple of SFRU6/U7 synthetic steepeners, +U6 9800c vs -0QU 9800c for 0 to 0.25. (+SFRU6 9800c). Also, buyer of 40k SFRU6 9700/9750cs vs sold 0QU 9700/9750cs, taking a credit of 3.25 20k. SFRU6 cs settled 10.0 vs 9682.5. 0QU6 cs settled 13.0 vs 9687. So SFRU6/U7 spread settled -4.5 (early seller in the sprd at -5.5). The option trade is synthetically long the calendar, which has curve roll as a stiff headwind; M6/M7 is -23. However, the premium credit is a small cushion, and if something blows up and forces the perception of a more aggressive Fed (like SVB), then a trade like this works.
Seller of 17k TYF 112.5/113.25 strangle at 43. Buyer of 20k TYH6 115c cov 112-265, 20d, paid 20. TYF 112p covered 112-235 with 19d, seller of 8k at 13. Finally a bottom fisher buyer 10k TYF 113/113.5 strangle 56 covered 112-22. Followed by a seller of 1400 BLOCKED UXYF 114/116.5 strangle at 25. (Rarely ever see UXY options trade).
–10y yield +5.4 at 4.11% with TYH6 -12.5 at 112-23. 30y yield +4.3 to 4.767. Jan treasury options expire in three weeks, on 26-Dec.
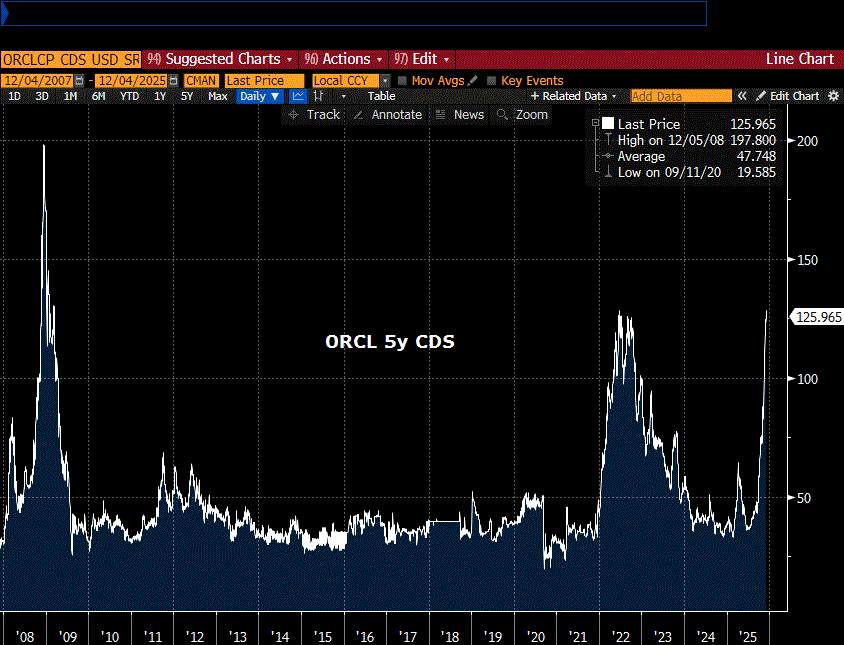
–I continue to see news clips and X posts about Oracle CDS, so here’s a chart:
Friars Win State! (and Farm Aid note)
December 3, 2025
********************
–First:
Congrats to Oak Park’s Fenwick Friars!
Fenwick shocks East St. Louis to win the 6A State Title
Huge night for Fenwick!
–Long end yields pressed higher Tuesday morning, but buyers came in and by the time of settlement, 10y yield was down about 1 bp to 4.085 and 30s down 0.5 to 4.739. TYH6 rose 2/32s to 112-285. Slight new high in 2/10 at 57.3, but that’s in the context of a months-long sideways trade. Needs to pop above 65 or so to indicate a chance of a breakout in the curve. SOFR contracts similarly muted at settle, with strip of 5 years +1 to +2. Peak contract SFRH7 settled +2.0 at 9694.5. Exit seller of 30k 0QF6 9700/9725cs at 6.0 (some covered). SFRH7 is underlying. Even with all the jawboning about a new, less independent Fed, red SOFR contracts aren’t straying far from a ‘terminal rate’ projection of around 2.75-3%. Red pack, second year forward, settled 3.07%.
–Amazing to me that SFRZ5 9625 straddle settled 5.0 (ref 9627) with 9 days until expiry (7 trading sessions). FOMC is 10-Dec. While FFF6 shows near certainty of a 25 bp cut, settling 9635 or 3.65 vs current EFFR of 3.89, we’re still in a fragile world with obvious dissension within the Fed…and everywhere else. Z5 9625p settled 1.5. 9631.25c settled 0.25, 9631.25/9637.5cs bought early yesterday for 0.25. [Back up the truck]. On the other side of the world, JGB yields continue to press to new highs, with 10y 1.90% today.
FARM AID
–In 1985 the first Farm Aid concert was organized. I associate it with Willie Nelson and John Mellencamp and Neil Young.
https://ipmnewsroom.org/quite-remarkable-the-farm-aid-benefit-concert-which-started-in-champaign-celebrates-40-years/
Forty years ago, a bushel of corn was around $2.90 and wheat around $3.25. Gold was $325/oz. This morning March Corn is 4.48 and March Wheat 5.41, not even double in FORTY YEARS! Feb Gold is $4232/oz, up 13x. In 1985, the US 10y went from 11% to 9%.
From KC Fed report last week:
Weakness in the crop sector weighed further on farm finances, and credit conditions tightened gradually in the third quarter of 2025. According to Federal Reserve District Surveys of Agricultural Credit Conditions, farm income and loan repayment rates in the Midwest and Plains States declined at a pace similar to recent months.
https://www.kansascityfed.org/agriculture/agfinance-updates/credit-conditions-tighten-gradually
Newsflash yesterday: Agriculture Secretary Brooke Rollins says the Trump administration will announce a “bridge payment” for farmers next week, designed to provide short‑term relief while longer trade and aid packages are finalized.
From last week: Hansen-Mueller Co., a Nebraska grain dealer, stunned the Midwest when it filed for Chapter 11 bankruptcy on 17 November 2025. The company has been in business for over a century, and owes hundreds of millions of dollars to farmers and creditors nationwide.
You might be forgiven for saying, who gives an F about bitcoin…
An honest man’s pillow is his peace of mind
Don’t Worry, Be Happy
December 2, 2025
*******************
–Rate futures weakened significantly yesterday with 10 and 30 year bond yields up 8 bps to 4.094% and 4.744%. Curve steepened somewhat with 2s rising 5 bps to 3.539%. A couple of bearish factors were concerns relating to a new Fed composition and surging Japanese yields. All SOFR contracts are below 9700 or 3%. Peak contract SFRH7 is 9692.5, down 6 on the day (recent high settle in that contract is 9716 from 8-Sept). SFRH8 -7.5 at 9679.5 and SFRH9 -8.0 at 9659.5. Front March, SFRH6 only fell 2.5 to 9642.5, supported in part by large call spread buying. Largest trade was new, +40k SFRF6 9656.25/9668.75cs bought vs sold 9637.5/9625.0ps, 1.5 to 0.75 credit to sell put spread. CS settled 1.75 and PS 3.0. There was also outright buying of the call spread only as open interest rose over 80k in both strikes. SFRH6 9637.5/9650cs also bought in size 40k for 4.25. The 12.5 wide call spreads didn’t work out in the Sept & Dec cycles; third time’s a charm?
–On 28-Nov, (end of month) EFFR set at 3.89, up 1 bps and SOFRRATE at a new recent high 4.12. QT ended yesterday. QE around the corner.
–At one point yesterday, a snapshot of SIH6 (silver) was 58.81 per ounce. CLH6 was 58.77. Buy a barrel of oil for an ounce of silver. One of those prices is wrong.
–BBG headline yesterday said Trump has made his decision on a new Fed Chair. I’m not worried.
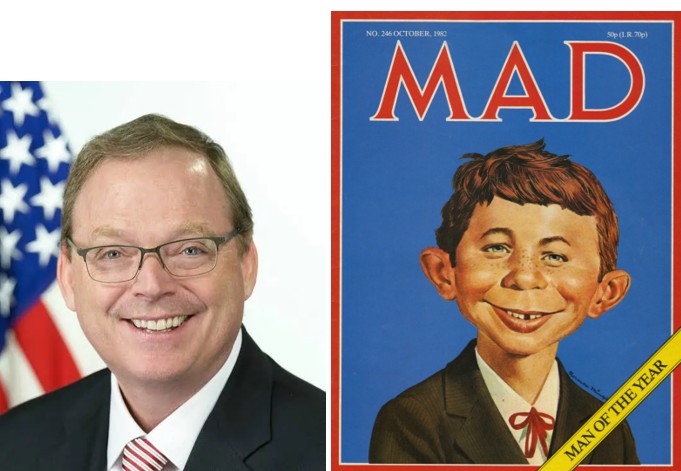
I actually like Hassett and wish him well if he’s the choice.
Getting around to some delayed projects
December 1, 2025
*******************
–I wasn’t in on Friday. Out doing some overdue repair work. Oh yes, cooling systems are being upgraded.

–Warren Buffet had been attracted to silver due to the supply/demand deficit. Charlie Munger was clearly miffed whenever the topic came up, because 1) he didn’t like owning things that don’t provide a stream of income and 2) he thought Buffet’s dabbling in silver didn’t have a chance in moving Berkshire’s needle because the market just isn’t large enough. The clip below is amusing:
Munger responding to a silver question: “I think it should be pointed out that you’re asking for the opinions of people who have not particularly distinguished themselves in this arena.” Buffet: “He was pointing at me.”
There are current rumors that someone wants delivery of 400 million ounces. Some time ago, Berkshire owned 129 million ounces. I can’t help but think that with Munger gone, and Buffet no longer having to publicly explain anything (“went quiet” on 10-Nov), is having a bit of fun in his retirement. At the start of September, spot silver was $40. As of this morning, Dec 1, silver is 57.60, a three-month gain of 45%. How do you like THAT, Charlie?
–Markets are starting December with some notable moves. As of this writing, bitcoin is printing 86.7k. On Friday it had recovered to just over 93k. Japan’s bond yields are making new highs, as Ueda strongly hints at a Dec hike. 10y JGB 1.86% today (from 1.62 at the start of Sept). The 20y is 2.88%, up 100 bps from the start of 2025. $/yen getting hit, currently 155.20. US equity futures are modestly lower with ESZ5 6823.5, -36.0. US 30y bond yield is 4.70%. up about 3 bps from Friday.
–ISM Mfg today for nov, expected 49.0 from 48.7 last.
Household Real Estate Stress
November 30, 2025 – Weekly comment
******************************************
According to the St Louis Fed website (FRED) :
Household Owners’ Equity in Real Estate as a Percentage of HH RE (Household Real Estate) has soared since the GFC, and is now 72.5%, the highest level since before 1960. The low in 2012 was 46%. Most people are surprised by this number. It is clearly skewed by age and affluence.
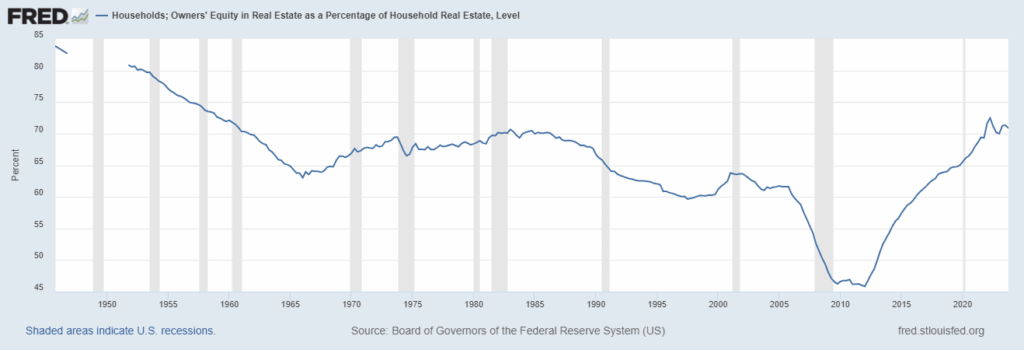
Household Equity as a Percent of HH Real Estate
According to the Fed’s Quarterly Z.1 report, HH & nonprofits Real Estate at Mkt Value is $53.22T. The HH part of that is $49.3T. The St Louis FRED site shows HH Owner Occupied RE Mkt Value as $47.3T. According to the NY Fed’s HH Debt and Credit Report, the amount of Mortgage Balances at end of Q3 2025 was $13T (13/47.3 = 27.5%, so that squares with the 72.5% of equity).
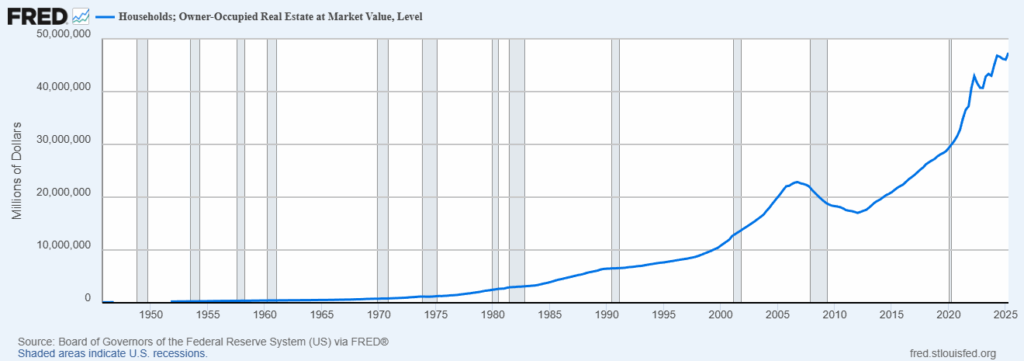
HH Owner Occupied Real Estate Market Value
The above chart shows that HH RE market value has risen from about $23T pre-GFC to $47T now, a bit over double. By contrast, total US equity market cap has more than tripled in the same period, from about $19.5T in 2006/07 to $62.8T at Q2 2025.
The two charts above would indicate, in aggregate, that risks to the economy from household real estate are small. However, the economic stress runs deeper. The median home price to median HH income ratio has grown steadily since the trough in 2011/12 and is now above the 2006 bubble high.
I listened to a podcast with Lyn Alden and she mentioned that a big refi boom is unlikely, as rates are no longer likely to move to significantly lower levels. I hadn’t really thought about that, but several things come to mind:
Cash-out refis occur when rates fall and/or house values increase. I believe that rates are likely to edge lower, but in the context of a weakening economy where home prices are stagnant or declining. Case-Shiller National House Price index was +1.3% ending in Sept. According to Redfin the median sales price in Oct 2025 is just under $440k, a yoy gain of 1.3%, same as Case-Shiller. Let’s assume a mortgage of $400k at current 6.35%. Monthly payment $2489. Drop the rate to 5.35% and the payment becomes $2234, a gain of $255/mo. Great! But what if your electric bill has increased by $100/mo? Add jumps in property taxes and insurance. Poof! It’s gone.
According to the NY Fed’s HH Debt and Credit Report, the amount of Mortgage Balances at end of Q3 2025 was $13T. If mortgage rates immediately dropped by 1% and this entire amount were to be instantly refinanced, the per month change would be about $8.3B/mo. It’s probably not enough to move the needle in terms of a ‘refi consumption boom’ (though it might go a long way in unfreezing the market). In 2005, with much lower general price levels, total mortgage equity withdrawals (which included home equity loans) were over $700b or over $50b per month.
The point is that a refi ‘wealth effect’ boom isn’t likely. Nor will a 50-yr mortgage help. According to the NY Fed, the refi rejection rate (which has ranged between 14.5% and 42% since 2024) printed at the high of the series at 42% in October 2025. Household credit access in general is becoming more constrained, especially now that student loan and buy-now-pay-later delinquencies are being reported to credit agencies.
As an example of the skew towards affluence and age, I was in a conversation with a neighbor in the wealth management business catering to high net-worth clients. I asked him how some of the younger people could afford $2 – $4 million houses in the Chicago area and wealthy suburbs. He said it’s easy, the parents borrow against their (now large) portfolios and pay cash for the homes. Quoting, “We do it all day”.
From Google:
The loan is a securities-backed loan or a securities-based line of credit (SBLOC), which is a type of secured loan where your stock portfolio serves as collateral. This allows you to borrow cash for a down payment without selling your investments, which helps you avoid capital gains taxes and keeps your portfolio intact.
As of Q1 2024 SBLOC estimated at $138b (according to a Fed paper). This data is NOT in the Fed’s consumer credit release. “The Federal Reserve Statistical Release G.19, “Consumer Credit,” captures securities-based lending as part of the depository institutions sector, which prevents us from constructing a measure of securities-based loans from the G.19 data sources directly. “
I’m sure SBLOC is a MUCH larger number now, but I doubt it’s over $1T. Since end of Q1 2024 SPX is up about 30%. Is this lending a risk? Probably not, but if home prices and stocks decline simultaneously, we’ll find out. Quickly.
Another factor regarding Household real estate is what Melody Wright called the “silver tsunami” (in a recent Thoughtful Money podcast). Boomers are about 20% of the population with a homeownership rate of around 80%. As this older cohort dies off, sales will accelerate, most likely at lower prices. Wright says this is already beginning. In order for median house sales prices to revert to reasonable levels with respect to median HH income, she estimates price declines of 38%!
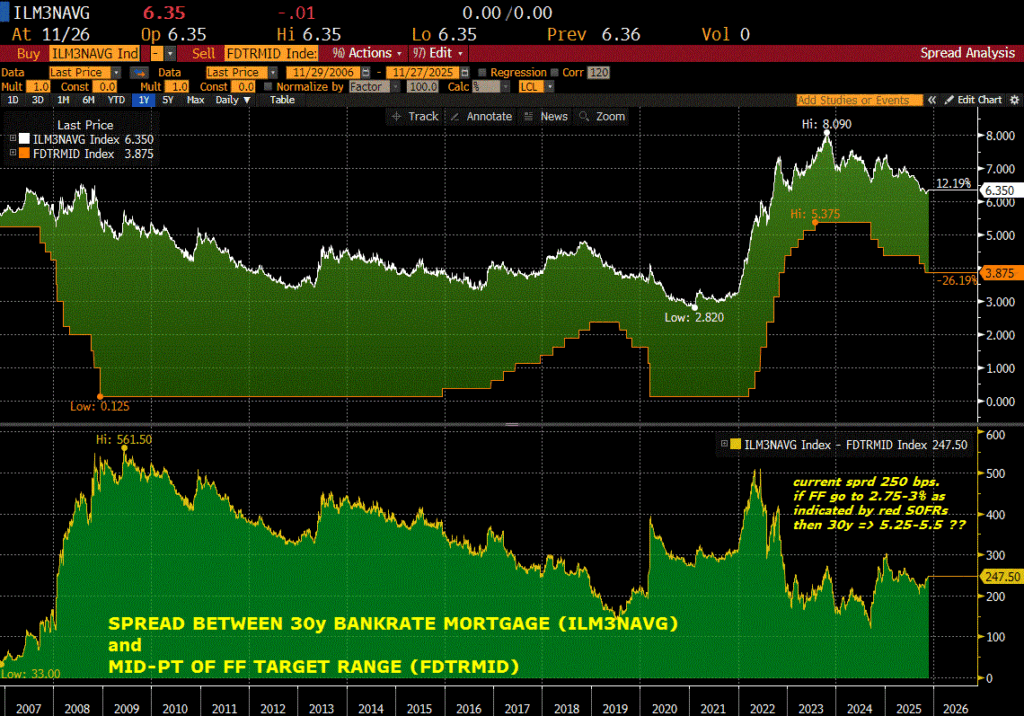
Below is a final chart showing the Bankrate 30-yr mortgage rate with the FF target range midpoint. Lower panel is the spread between the two. While the 30y mortgage was between 3.25% and 4.75% from 2011 to 2018, that period featured much lower FF levels. SOFR contracts one-year forward are projecting short-term rates around 3%. If the spread tightens to 200 bps (from current 250) then the mortgage rate could decline to about 5-5.25%.
| 11/21/2025 | 11/28/2025 | chg | ||
| UST 2Y | 349.4 | 348.9 | -0.5 | |
| UST 5Y | 362.0 | 359.6 | -2.4 | |
| UST 10Y | 406.3 | 401.3 | -5.0 | |
| UST 30Y | 471.3 | 466.3 | -5.0 | |
| GERM 2Y | 201.2 | 202.6 | 1.4 | |
| GERM 10Y | 270.2 | 268.8 | -1.4 | |
| JPN 20Y | 278.8 | 282.8 | 4.0 | |
| CHINA 10Y | 181.3 | 183.0 | 1.7 | |
| SOFR Z5/Z6 | -75.5 | -68.8 | 6.8 | |
| SOFR Z6/Z7 | 6.0 | 4.0 | -2.0 | |
| SOFR Z7/Z8 | 21.0 | 19.5 | -1.5 | |
| EUR | 115.17 | 115.98 | 0.81 | |
| CRUDE (CLF6) | 58.06 | 58.55 | 0.49 | |
| SPX | 6602.99 | 6849.09 | 246.10 | 3.7% |
| VIX | 23.43 | 16.35 | -7.08 | |
| MOVE | 78.81 | 68.95 | -9.86 | |
In: Eurodollar Options
EXTENDED holiday
November 28, 2025
*********************
–CME is still off line due to a cooling issue at its data center. Funny, as it’s right at the freezing point in Chicago!
–Friday’s features included exit sales of ERIS SOFR swaps: -35k YIYZ25 (10y) and -25k YIWZ25 (5y). Trades were entered in early Nov, and appear to have worked out as a hedge, as the US 10y yield is down about 11 bps from early Nov. On Wednesday, 10s were nearly unch’d at 3.996%. The high on 5-Nov was 4.16.
–Also a large buy Wednesday of SFRH6/SFRM6 3-month calendar, +55k from -25.5 to -25.0. This trade appears new as open interest in H6 increased 55k and in June OI +26k. Settled -25.5 (9645.5 and 9671.0). Since August, this 3-month calendar has ranged from -27.5 to -20.0. Given that the two contracts straddle the end of Powell’s term in May, there had been thoughts of a new Fed Chair slashing rates, which would drive this spread much more NEGATIVE in price. The buyer is fading that view. On a roll basis, SFRZ5/H6 is -19.5 (9626/9645.5) so from that standpoint the buys make sense. Note that the following 3-month spread is also higher in price at -18 (9671/9689). Simply a trade expressing the view that H6/M6 is ‘out of line’ given that Fed policy may not change much? Possible.
–Worth noting that red sofr contracts were weakest on the strip Friday. New low in red/green SOFR pack spread at 12.375 bps, -1.25 on the day. Examples: SFRH7 (red March, the highest point on the SOFR strip) settled 9701, -3 bps. SFRH8 -2 at 9689.5 (green March). SFRH9 -1 at 9671.0. 2/10 treasury spread eased slightly as well to 51.5 with the 2y yield +2 bps at 3.481 and 10’s unch.
Hassett priced?
November 26, 2025
********************
–Markets perked up a bit when a newsflash indicated that Kevin Hassett was a front-runner for the Fed Chairmanship. New low in SFRH6/H7 one-year calendar at -57.5 (9646.5, +0.5 and 9704.0, +4.0). SFRH6/U6 six-month spread captures the end of Powell’s term settled -45 (9646.5/9691.5) down 2.5. However, 2/10 spread barely moved at 53.9. 2y yield fell 2.6 bps with 10s -3.6 to exactly 4.00%. Jan Fed Funds settled at a new recent high 9634.5, with a price of 9637 representing certainty of a 25 bps cut at the Dec 10 FOMC.
–So, FFF6 is expressing near certainty of a 25 bp cut at the Dec 10 FOMC in front of today’s Beige Book. However, the spread between SFRZ5 (which already reflects the Dec ease) and SFRH7, the peak contract on the SOFR strip is only -77.5, indicating 3 more eases. (SFRZ5 9626.5, +1.0 and SFRH7 9704.0, +4.0). Concerns related to a new surge in inflation are plausible, but the 30y yield FELL 2 bps yesterday to 4.657% and the 10y breakeven, (10y treasury vs TIP, a long term inflation proxy) fell to a new recent low of 224 bps. Perhaps the possibility of a peace agreement with Russia is a counterweight to inflationary impulses.
–Premium in treasuries continues to sink, partially due to stripping out time value for the holiday. TYF6 atm 113.5^ settled 1’14, down from 1’21 Monday. Some notable selling in 5y: FVF 110^ sold at 0’52 (4k, settled 0’51) and FVH 110^ at 1’27, settled 1’26. FVF 110.75/111 call strip sold at 15, 12k, settled 15. 110.75 strike approx 18 bps otm. 5y close yield at 3.567%.
–Range in 10y B/E has been 247 bps to 217 (right after Liberation Day in April). The new buzzword in articles about the economy is “affordability”. There seems little chance of bringing inflation back down to 2%. Assume Fed cuts to 2.75-3.00 by summer and inflation is 2.25 to 2.50%. Real rate of 50 bps; probably mildly stimulative (for financial assets anyway) but it’s already being priced to a large extent. That’s IF inflation comes down.
–There was a seller of SFRZ5 9625p at 3.0 vs 9625.75, or 6.75 equivalent in the straddle, which settled 7.0. Seems cheap but probably appropriate.
–Buyer 15k SFRU6 99.00/100.00 cs for 1.5 covered 9689.5 with 5 delta. Settled 1.0 vs 9691.5. Ever since SVB there’s an upside bid.
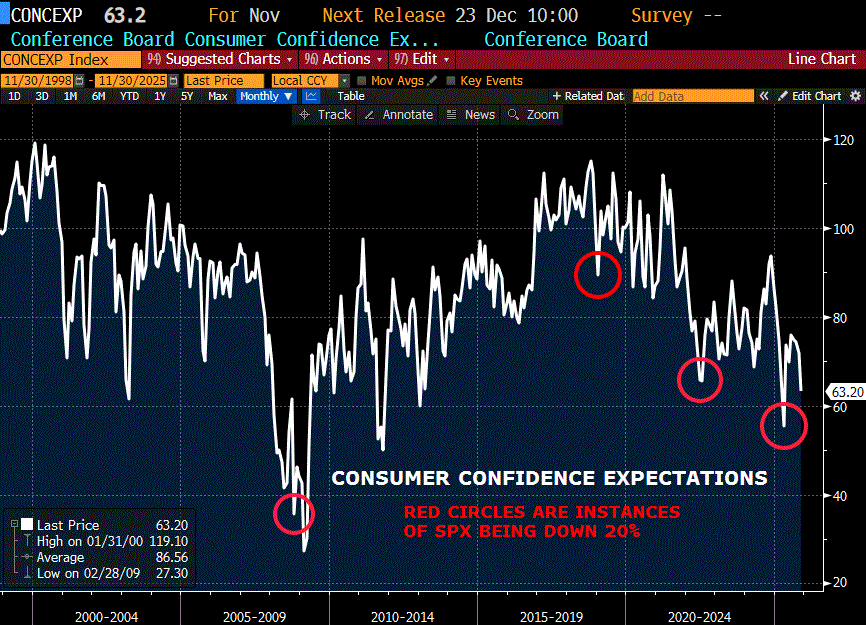
–Jobless Claims expected 225k from 220k Consumer Confidence and Expectations are horrible. Why? AFFORDABILITY.
Rate Cut Uncertainty Receding
November 25, 2025
*********************
–Yesterday afternoon WSJ reported that SF Fed’s Daly said she can support a rate cut in December. Daly’s not a voter, but my view is that she follows whatever Powell wants, so I view this story as a signal that Powell favors a rate cut. SFRZ5 was the strongest contract on the strip yesterday, +3.0 at 9625.5. Jan Fed Funds rose 3.5 to 9634; 100% odds of a cut would be 9637. Removal of doubt over the Dec 10 FOMC (rightly or wrongly) spilled over into rate options where vol was crushed. For example, SFRH6 9650^ settled 25.0 yesterday (9646) vs 28 on Friday (9645). 0QH5 9700^ from 40 to 38 with SFRH7 -0.5 to exactly 9700. SFRH7 is the peak contract on the strip, now at 3.0%. Worth a mention is that the 10yr breakeven (Treasury – Tip yield) closed 225.3 bps, a new recent low (long term inflation proxy).
–In TY, Jan 113.25^ settled 1’19 (Friday was 1’27 for the 113^) and the March 113.0^ was 2’21 Friday, vs 2’15 for 113.5^ yesterday. Huge longs in Jan 113.5 and 114 calls suffered. TYF6 straddles from Friday to Monday: 113.5^ from 1’36 to 1’21 and 114^ from 1’50 to 1’29.
–Q3 Advance GDP has been cancelled. However, today we get Consumer Confidence, expected 93.3 from 94.6. The plunge in this data makes today’s release important. Five year auction as well.
–This morning, there are reports that NVDA shares are under pressure due to a competitive chip threat from Google. Last I checked NVDA -5.73 or 3.2%. Another interesting decline is Softbank, this morning down 9.95% at 15390 yen. Still up huge on the year, but at the end of October it was 27315, so down 43% in less than a month.
–Related to the state of consumers: ‘…More US consumer falling behind on utility bills’
Past due balances to utility companies jumped 9.7% annually to $789 between the April-June periods of 2024 and 2025, said The Century Foundation, a liberal think tank, and the advocacy group Protect Borrowers. The increase has overlapped with a 12% jump in monthly energy bills during the same period.
..
What if Fed Cuts in Dec and no one cares
November 24, 2025
**********************
-Friday’s price action depended heavily on this early morning quote from NY Fed President Williams:
“I view monetary policy as being modestly restrictive, although somewhat less so than before our recent actions. Therefore, I still see room for a further adjustment in the near term to the target range for the federal funds rate to move the stance of policy closer to the range of neutral, thereby maintaining the balance between the achievement of our two goals.”
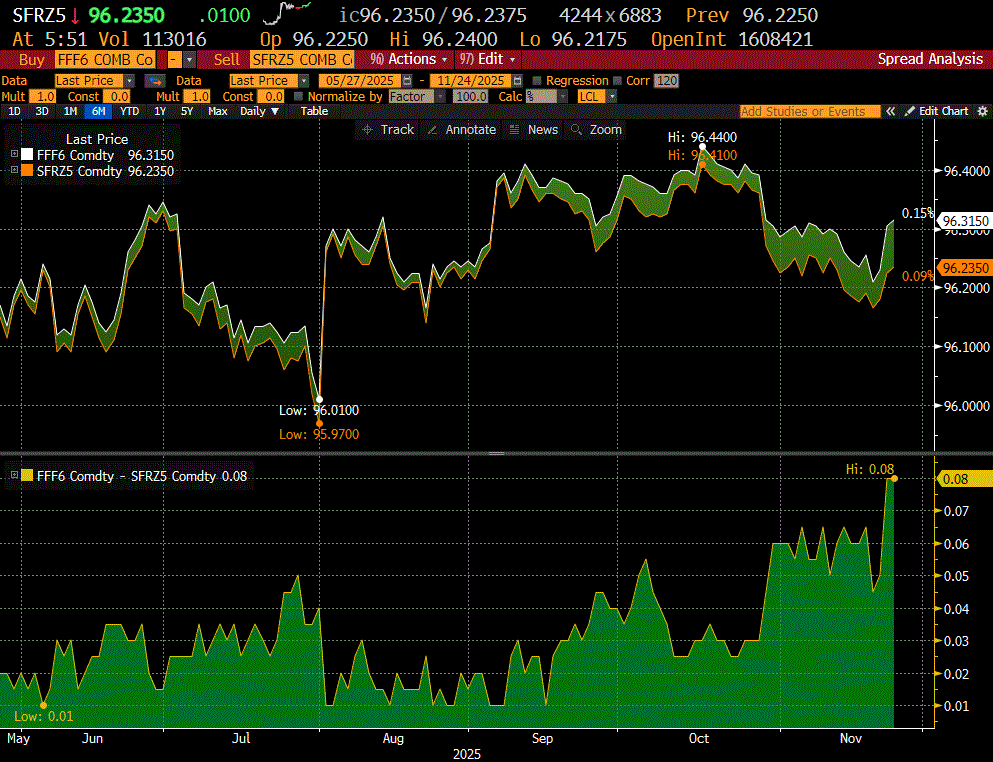
–Jan Fed Funds (FFF6) ripped 7.5 bps higher to a price of 9630.5, from just under 50/50 odds for an ease on Dec 10, to around 70% odds of an ease. SFRZ5 settled 9622.5 (+4.5). Z5 9625 straddle settled 10.0. The spread of FFF6 to SFRZ5 is at its peak of 8 bps. It was 1 to 3 in September. Should be more like 5 or perhaps even lower depending on odds of another ease on Jan 28, but repo tightness is holding SFRZ5 down, even as the Fed insists there’s no stigma associated with using SRF (standing repo facility).
–SOFR contracts +3.0 to +5.5 in the first five years. Ten-yr yield fell 3.9 to 4.063%. Slight new highs in 2/10 at 55.1 (+0.5) and 5/30 at 109.5 (+3.6). Both of these spreads have been sideway for months and are still in below the highs for the year. Max 2/10 this year has been 65/66. Auctions of 2, 5 and 7 year notes Monday, Tuesday, Wednesday.
–Not sure if the resignation of Marjorie Taylor Greene from Congress is important, but at the margin it likely erodes Trump support. Midterms are a year away. Added urgency to cut rates? In any case, forward rates still aren’t embracing the idea of a series of cuts. SFRH6/M6 did make a new recent low of -26.5 (9645/9671.5) and SFRH6/U6 new recent low -44.5. But consider the next six-month spread forward, SFRU6 to SFRH7, it’s only -11 bps (9689.5/9700.5). SFRH7 is the peak on the SOFR strip at 9700.5, right around 3%. If the Fed cuts in December, the new target will be 3.5 to 3.75%, so SFRH7 is only 62 bps away from what will be the new midpoint.
–A couple of interesting notes from Fed Gov Cook speech Thurs:
Trading venues are also taking steps to mitigate the risk stemming from the “black box” problem associated with AI-enabled trading algorithms. For example, the Chicago Mercantile Exchange (CME) recently reminded its members that they must be able to fully explain and reproduce any decisions or actions taken by their algorithms on the CME market. [*pulls out dartboard]
Hedge funds’ holdings of Treasury cash securities—that is, Treasury bills, notes, and bonds—have increased from representing about 4.6 percent of total Treasury securities outstanding in the first quarter of 2021 to representing 10.3 percent in the first quarter of this year, just above its pre-pandemic peak of 9.4 percent.
–Berkshire owns $360 billion in t-bills. In the ‘hedge fund’ category? Easing SLR under serious discussion?

