
May 13. Clear Sailing Ahead
In the early part of March, prior to the March 21 FOMC meeting, 5/30 treasury spread was around 50 bps. Following that meeting it’s been in a fairly steady decline, closing at a new low Friday of just over 27 bps. We’re now one month away from the June FOMC meeting, which is fully priced for a hike. Is it reasonable to assume, in the wake of the June meeting, that another 25 bps will be extracted from 5/30, which will put it around zero by midsummer?
The Fed has wanted to tighten financial conditions. A relatively soft dollar, tight corporate spreads, and tame long end rates paired with low implied vols suggests that the current round of tightening hasn’t had much bite. Even equities, though a bit more volatile, are nearly unchanged from the start of the year. Where conditions ARE tightening is in emerging markets, for various reasons. However, Powell’s speech last week more or less dismisses the US influence on Emerging Mkts, noting that the Fed has been transparent in communicating intentions.
Last week long end yields barely moved in spite of new highs in crude oil. The inflation data were slightly lower than expected, allowing the market a sigh of relief, and new long dated supply was absorbed with the same ease that Rosie uses a Bounty paper towel to wipe up spilled coffee on the deli counter.
Regarding the June FOMC, Jim O’Sullivan, Chief US Economist of High Frequency Economics and Forecaster of the Year in 2017, says that language in the statement may be tweaked as soon as June to reflect a need to upgrade the stance of FF to neutral from accommodative. He mentioned the March FOMC minutes, and below is an excerpt which makes the case:
Several participants expressed the judgment that it would likely become appropriate at some point for the Committee to set the federal funds rate above its longer-run normal value for a time. Some participants suggested that, at some point, it might become necessary to revise statement language to acknowledge that, in pursuit of the Committee’s statutory mandate and consistent with the median of participants’ policy rate projections in the SEP, monetary policy eventually would likely gradually move from an accommodative stance to being a neutral or restraining factor for economic activity. However, participants expressed a range of views on the amount of policy tightening that would likely be required over the medium term to achieve the Committee’s goals.
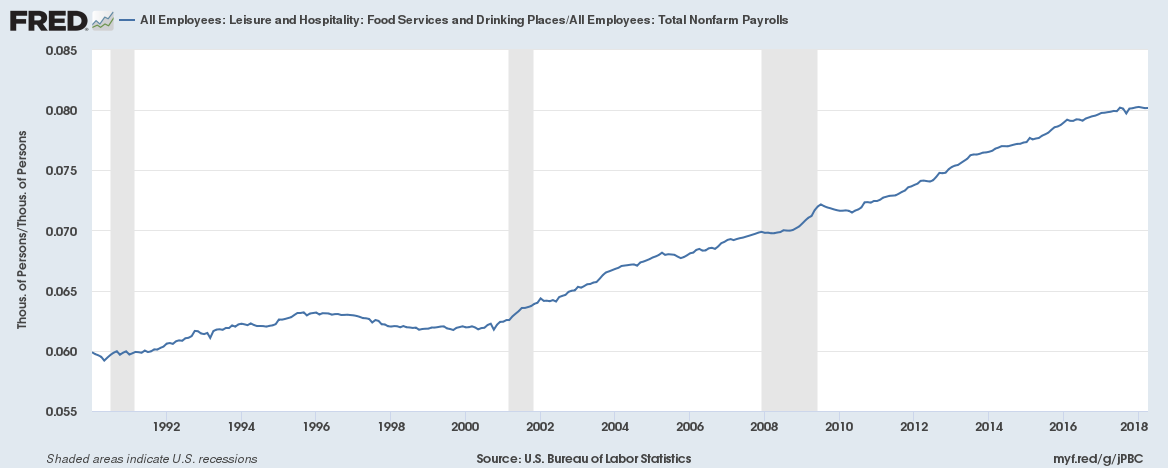
By the way, between now and the next FOMC there is another payroll report on 1-June. If there’s a possible catalyst for higher yields, it may be the Average Hourly Wage data which now seems to be the last missing puzzle piece. On the other hand, just for fun I created the chart below. (I guess I’m not the only one that supports the local bartender). It’s a bit hard to see the scale, but since the year 2000, the percentage of people employed in Leisure and Hospitality, Food Service and Drinking Places has gone from 6.2% to 8% of payrolls. Good times. As Wayne Campbell says, “I’ve had plenty of ‘Joe’ jobs. Nothing I’d call a career. Let me put it this way, I have an extensive collection of name tags and hairnets.”
Of course, robots are now taking those jobs, which may hold wages down. On the other hand every time I see a creepy demo video from Boston Dynamics I think of the good part: these kids won’t need to go into battle. Just strap a laser on Fido here and you’ve got a heck of a fighting force. Might as well just buy the stocks of gaming companies. They’re the ones with the technical know-how and hacking skills that will be at the core of future conflicts.
https://www.youtube.com/watch?v=Ve9kWX_KXus
One last brief thought on EM. Argentina quickly disintegrated from successfully selling 100-year dollar denominated bonds to getting an IMF bailout. US corporates continue to buy back their own shares, and while some finance buy backs out of operating cash, others borrow, diluting balance sheets. In any case, corporate debt is at a record of GDP, over 45% and above previous peaks in 2001 and 2009. When rates rise, the flame-out can occur fast, but it’s not here yet.
| 5/4/2018 | 5/11/2018 | chg | |
| UST 2Y | 249.7 | 253.5 | 3.8 |
| UST 5Y | 278.0 | 283.7 | 5.7 |
| UST 10Y | 294.4 | 297.0 | 2.6 |
| UST 30Y | 311.4 | 311.0 | -0.4 |
| GERM 2Y | -58.0 | -58.1 | -0.1 |
| GERM 10Y | 54.4 | 55.9 | 1.5 |
| JPN 30Y | 72.7 | 73.9 | 1.2 |
| EURO$ Z8/Z9 | 32.5 | 35.5 | 3.0 |
| EURO$ Z9/Z0 | 5.5 | 7.0 | 1.5 |
| EUR | 119.63 | 119.42 | -0.21 |
| CRUDE (1st cont) | 69.72 | 70.70 | 0.98 |
| SPX | 2663.42 | 2727.72 | 64.30 |
| VIX | 14.77 | 12.65 | -2.12 |
May 11. ZZZZZZZZZZZZZZZZZZZZZ
–5/30 closed at a new low of 28.5. CPI was lower than expected but the NY Fed’s Underlying Inflation Gauge made a new high in April, with the ‘full data set’ at 3.20 from March’s 3.15. ‘Prices only’ increased from 2.23% in March to 2.29% in April.
–Once again near euro$ calendars edged to new highs. Peak 3-month is EDU/EDZ which closed +0.5 at 17.0. The peak one-year June’18/June’19 closed 53.5, +1.5 and closing in on the constant maturity high of 60.5. Sept/Sept also posted a new high of 46, +0.5 on the day.
–Implied vol pounded into submission. TYN 119 straddle settled 1’05, just 3.3. Perhaps today or Monday it will flirt with 1 point with around 40 days to go. Quite early. May midcurve options in euro$’s expire today. While EDM9 was 9711.5 bid, there was a seller of 0EK ^ at 2.0. EDM9 settled at 9710.5, giving market makers a slim glimmer of hope. If bought futures at settlement then left with free calls. Which will expire worthless.
–EDU8 9750 straddle settled at new low of 12.0. With EDM 9764, if anything happens to derail a Sept FOMC hike following June’s, then the call ought to settle above 12. If the Fed is set on the path of quarterly hikes, then 9737.5/39.0 is reasonable.. Actually seems worth buying a Sept/Dec or Sept/March straddle spread. Sell EDU at 12 and buy EDH 9725 at 26?
Comfortable with higher rates and higher oil
–Interest rate markets remain very quiet, with the ten year auction going off just under 3%. The short end continues to be weak, with new highs in a few near calendar spreads. For example, EDM8/EDM9 one-yr spread closed 52.0, +2.5 on the day, with EDU8/9 45.5, +2.0. Both are new high settles. The peak 3 month spread is Sept/Dec which closed 16.5. Staying with the short end, note that some FF contracts made new lows. For example, FFF9 (January) closed at a new low of 9771.5. With the current Fed effective 1.70, July FF at 9805.5 (1.945) is fully pricing June’s hike. If we assume a new Fed eff of 1.95, then two more hikes into year end would be 2.45, vs Jan FF of 2.285. Aug/Oct FF calendar isolates the Sept FOMC; the spread settled 18 so approx 75% chance of a hike at that meeting, while, Nov/Jan closed 12.5, so 50% for the Dec meeting.
–CPI expected 0.3 with Core 0.2, (yoy 2.5 and 2.2), but interest rate markets now apparently feel comfortable with a small overshoot of the Fed’s target, given that hike odds are aggressively priced. Thirty year auction today with w/i 316/315 at futures close. The thirty year bond is only giving a yield advantage of 5/8% over the two year note; not much there in terms of ‘inflation premium’.
–Energy stocks like the high oil prices. I guess the rest of the market is satisfied (looking at greens and blues of the euro$ curve which suggest a terminal FF rate of 3% or lower) that gradual rate hikes can be absorbed. After all, in 1993, 3% WAS the emergency low funding rate.
May 9. Emerging markets, stocks vs bonds
Below is chart of EEM in amber, the Emerging Mkt etf, vs EMB in white, the Emerging BOND etf. I have no idea what the composition is of each of these; I only just learned there WAS an emerging bond fund. Obviously, the Argentine bonds are exerting a downward influence in the bond etf… not much of a surprise there.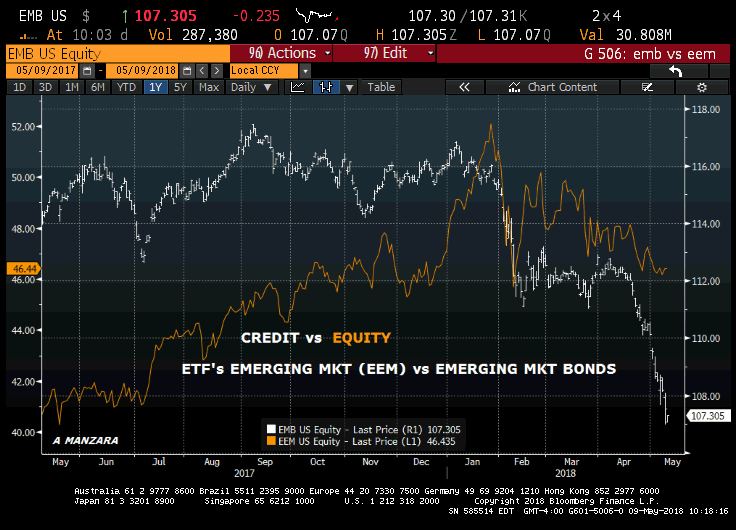
Just sort of interesting to see the divergence, and given that US corporates have been borrowing in order to fund stock buybacks (thus diluting balance sheets) it might be worth keeping an eye on this chart. Will credit concerns pull stocks down?
May 9. Possible auction drama
–Trump exits the Iran deal, oil jumps $2/bbl to new highs, and stocks rally. Hmmm. Today brings the ten year note auction against a backdrop of heightened inflation concerns, in which oil plays a major role. Today’s PPI is expected +0.3 with Core +0.2. Tomorrow’s CPI is expected to print +2.2% yoy Core. With tens just above the relatively juicy yield of 3%, there should be decent demand. However, there’s a chance that increased supply will be overwhelming, and if there’s a continued pullback of foreign buying (low indirects) it could be quite negative going into tomorrow’s 30 yr.
–Big new trades yesterday, +60k TYM 118p 3. That strike represents around 3.15% yield. EDH9 9687p 2.0 for 100k vs 9720.5 to 22. Put settled 1.75 vs 9723 with open interest +65k. With a June hike priced into the FF market, and EDM8 hugging the 9762 strike, the EDH9 puts look like a simple play for continued hikes at every quarterly meeting going into the beginning of next year, with the possibility of an off quarterly hike thrown in. One other trade of note was a seller of EDU8 9750 straddle vs 9762c which was sold at 10.5 in about 40k.
–Implied vol firmed slightly but is still remarkably low given the chance of an inflation ‘breakout’. While TYM 118p seem far away, anyone needing downside protection would probably want to get it in place prior to the auction.
May 8. Consumer credit deceleration
–Late profit taking turns in both crude oil and stocks after Trump tweeted “I will be announcing my decision on the Iran Deal tomorrow [Tuesday] from the White House at 2:00 p.m.” Oil slipped back below 70 and stocks ceded a few points as well. The opening of the US Embassy in Jerusalem in one week, May 14, is another possible flashpoint.
–Light volume yesterday with no euro$ contract trading over 100k. Yields were nearly unchanged, edging higher by 1 bp or less across the curve. Treasury kicks off the auction cycle with threes today.
–Consumer Credit yesterday showed an increase of just $11.6b, below expectations of $15b. Although this is likely just payback from storm induced buying last year, revolving credit has declined for the past 2 months, -0.6 in Feb and -3.0 in March. Pretty ominous signal if it continues. The total growth (including non-revolving autos and school loans) was 3.6% but that is showing deceleration as well. In Q4 the rate was 6.9%, in January 4.7, Feb 4.3 and March 3.6.
–AAPL had a gap open to new highs yesterday as the public jumped on Buffet’s bandwagon. However, I would note that Buffet said he would by more ‘at the right price’, which probably doesn’t mean new highs. AAPL closed on its low on light volume, and left a gap from 184.25 to 184.75. It appears likely that there will be a gap open lower today, leaving a potential island top.
May 7. Rates sit as other markets fluctuate
- “South Korean export growth, a notoriously good global cyclical indicator, turned negative for 1st time since 2016.”

May 6, 2018. As Good As It Gets
I was skimming the news sites Saturday morning and on the Wall Street Journal’s there was a long term chart of the unemployment rate which noted the last time the rate was this low (3.9%) was Dec 2000. Let’s take a look back.
From 1995 to 2000 the FF rate bounced around between 4.75 and 6%. In late 1997 the rate was 5.5%. In Sept 1998 we had the LTCM crisis and by the end of the year the Fed had cut… to 4.75. At the time, LTCM was a major crisis, threatening to bring down the entire financial edifice. The Fed famously gathered the major financial players to arrange a bailout. By June 1999, Greenspan began to hike again, ending the year at 5.5%. This was the dot-com era. The turn of the century. In February, 2000, the Fed hiked to 5.75, then to 6% in March, followed by a 50 bp dinger on May 16. Eighteen years ago. And that was the peak, 6.5%.
https://www.thebalance.com/fed-funds-rate-history-highs-lows-3306135
Amusingly, a CNN/Money piece at the time noted, “[The Fed] also gave an onerous hint that it will implement more rate increases in the months to come if need be to ensure the now-record economic expansion continues forward without stumbling.” Why, that’s just what we’re being promised now.
http://money.cnn.com/2000/05/16/economy/fomc/
The article is quite an interesting throwback. Here’s a snippet, which could have been written today:
What concerns Fed officials is that that mix may be starting to end. The sizzling U.S. job market has spurred employers to start doling out higher wages and benefits to workers to keep them from leaving. And those workers, armed with bigger paychecks and pleased with the gains they’ve made investing in stocks and real estate, have continued to spend in the face of rising rates — something that has begun to give some retailers the green light to begin lifting prices.
Even so, overall inflation still remains remarkably subdued.
Well perhaps it’s not exactly the same as today, but an article on Bloomberg notes some of the same conditions, for example, the Q1 Employment Cost Index showed private-sector wages posted the strongest yoy gains of this expansion.
The unemployment rate had been in decline going into the year 2000, and throughout that year remained between 4.1 and 3.8%. By January of 2001 it was 4.2% and never looked back, marching higher into 2002. Stocks were on a tear going into the turn of the century, with Nasdaq surpassing 5000 for the first time in March 2000. SPX had broken through 1500, but topped out just above that level in August. In terms of the curve, the red to gold ED pack spread declined as the Fed hiked, inverting below zero in March. After the May hike, the curve bottomed, and a year later was 100 bps as the Nasdaq bubble rapidly deflated. Red/gold has also declined during this current hiking cycle, having made a new low in the middle of last month at 8.25 bps.
Both then and now, the sub-4% employment rate begs the question: Is this as good as it gets?
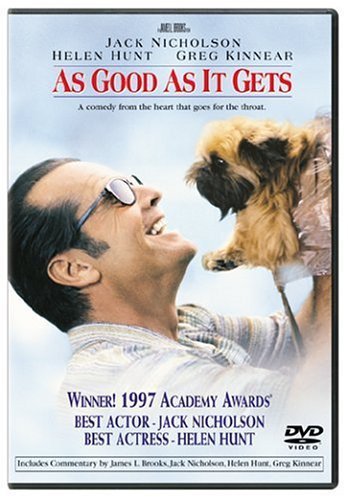
In 1997, Jack Nicholson starred in a movie of the same name. He played Melvin Udall, an obsessive-compulsive romance novelist who rudely insults almost everyone he meets.
There’s a line in the movie that reminds me of our current US government. Jackie, the starry-eyed receptionist who is a fan of Melvin’s romance books breathlessly asks him, “How do you write women so well?” Melvin responds, “I think of a man. Then I take away reason and accountability.”
https://www.youtube.com/watch?v=pBz0BTb83H8
Might as well ask, how does the American government manage its financial affairs? With trillion dollar deficits looming, there doesn’t seem to be much in the way of reason. And in the old days, perhaps the bond vigilantes would force accountability. No longer. However, we may get a taste of the old medicine as the treasury auctions 3s, 10s and 30s this week. These three auctions are supposed to raise nearly $34 billion in NEW cash. Rates barely moved Friday, or, for that matter, on the week. Net changes across the curve were within 2 bps, with tens -1.3 to 2.944%. Will we see a concession this week? Besides the auctions, we’ll get inflation data on Wednesday and Thursday (PPI and CPI), and Trump’s expected refusal to extend the Iran deal. As an interesting side note, this week’s Bank of England meeting is now leaning toward no change in rates, an abrupt reversal from previous guidance. As Barclay’s notes (from a Reuters article) “Resetting communication after sitting out a rate hike will be an uphill task for the Monetary Policy Committee.”
The takeaway is that central banks, with all of the financial data and analysis at their fingertips, often have a hard time identifying turning points. It was true in 2000, and in 2007. Flatness in the back end of the curve is telegraphing the possibility of economic weakness towards the middle or end of next year, and increased treasury supply may accentuate a move toward tighter credit conditions. Maybe this IS as good as it gets.
***********************************************************************
Note: the CME begins trading SOFR this week. The NY Fed site has daily data at https://apps.newyorkfed.org/markets/autorates/sofr
On the CME website see: http://www.cmegroup.com/trading/interest-rates/secured-overnight-financing-rate-futures.html
| 4/27/2018 | 5/4/2018 | chg | |
| UST 2Y | 248.0 | 249.7 | 1.7 |
| UST 5Y | 279.9 | 278.0 | -1.9 |
| UST 10Y | 295.7 | 294.4 | -1.3 |
| UST 30Y | 312.5 | 311.4 | -1.1 |
| GERM 2Y | -57.8 | -58.0 | -0.2 |
| GERM 10Y | 57.1 | 54.4 | -2.7 |
| JPN 30Y | 73.0 | 72.7 | -0.3 |
| EURO$ Z8/Z9 | 33.5 | 32.5 | -1.0 |
| EURO$ Z9/Z0 | 8.5 | 5.5 | -3.0 |
| EUR | 121.31 | 119.63 | -1.68 |
| CRUDE (1st cont) | 68.10 | 69.72 | 1.62 |
| SPX | 2669.91 | 2663.42 | -6.49 |
| VIX | 15.41 | 14.77 | -0.64 |
May 3, 2018. Dry
–Utter lack of drama associated with both the treasury refunding and the FOMC announcement. Yields barely changed on the day. The financial press focused on Tesla’s earnings call, and Musk’s terse cut-off of inquiries. “Sorry,” Musk said, “these questions are so dry. They’re killing me.” I guess Musk wants analysts to reflect on the big picture of really cool design and technology, and keep pesky issues like HUGE CASH BURN under the floor mats. Could it be that this second topic wends its way into the more general economic discussion? How patient are creditors given low yields? There was a story yesterday that *gasp* Argentina’s 100 year bond was under water as the currency tanks. So forgiving and yield-starved were the capital markets that Argentina easily floated 100 year bonds. That was then…
–Well, Elon, you don’t like dry and boring? Then stay away from interest rate options. (And, for that matter, avoid presentations on SOFR). Yesterday straddles continued their descent. Seller of 100k 0EM 9712.5p at 5.5 caused 0EM straddle to settle 11.5 from 12.5. Total of 121k open interest evaporated in 0EM puts alone (72k in the aforementioned 9712 strike). The shorts are throwing in the towel. USM up a few ticks and the atm call sat unchanged, with all the damage accruing to the puts.
–Today’s news includes Factory orders expected +1.3 and ISM Services at 58.4. US trade delegation in China.
May 2. Refunding
–Breakout of the dollar continued with DXY and EUR through 200 day moving averages. Stocks had a nice run both before and afterAAPL’s earnings. Fifteen mins prior to cash close AAPL was 168.90, ESM 2647.00 and NQM 6666.00. As of this writing ES is 10 points higher while Nasdaq is 59 higher. July Corn also appears to be breaking out to the upside, trading 405 late.
–Interest rates were quiet, with flows dominated by premium selling. Yields rose with the ten year +4 bps to 297.4. Near ED calendars posted new highs. EDM8/EDM9 closed 51.0, +3 on the day as interest in 0EM puts continues prior to the employment report. EDZ8/EDZ9 closed at 35, not a new high, but just above the heavy selling level of 34.5 seen last week.
–Today’s news includes the Treasury refunding announcement at 8:30 (a likely contributor to higher yields) and the FOMC meeting in the afternoon.
–Interesting trade late in the day was a new buyer of 80k 0EU/2EU 9737c calendar for 0.5 covered 9702.5 in EDU9. EDU9/EDU0 spread is 10.5 and both options settled 3.25. Trade works on a roll up, and possibly on a change in Fed perceptions (an end to tightening). As a comparison, 0EM 9737c settled 1.0 and 2EM 9737c 0.5.
–Interesting speech by BOC Poloz yesterday, outlining concerns about high debt levels while still looking to raise rates. This line sort of sums it up for the developed world, and is something Dudley has also mentioned/warned about. “Remarkably, the aggregate debt-service ratio on mortgages for Canadian households has been very stable, remaining within a range of 5 to 7 % since the early 1990s. What this means is that Canadians have taken advantage of lower interest rates to carry a higher level of debt, thereby keeping the debt-service ratio fairly constant.” In other words, it’s a heavily debt-laden, cash flow dependent economy that has a hard time withstanding rate increases.

