
May 1, 2018. “There is a lot of supply”
–Even the Drudge Report is highlighting concerns about Treasury buying, with one linked article to Bloomberg (US borrowed record $488b in Q1), and one linked to WSJ reporting that indirect auction bids (which often represent foreign buying interest) are dwindling. From BBG:
“It’s a very large, robust market — it’s the most liquid market in the world, and there is a lot of supply,” he [Mnuchin] said in a Bloomberg TV interview on Monday. “But I think the market can easily handle it.” Earlier on Monday the Treasury said net borrowing totaled $488 billion from January through March, a record for that period and about $47 billion more than it had previously estimated…”
–By the way, the last time borrowing was this large was 2008, during the crisis. Now the borrowing comes at a time of slightly accelerating inflation amid domestic stimulus and risk of trade wars. Sure, the market can handle it, but at what yield?
–Month end buying and jitters related to Netanyahu’s speech on Iran caused bull flattening on light volume. As is often the case, premium sellers like the flatter curve. Bund vol closed at or near an all time low at 3.2. Treasury vol also weakened. Notable selling of EDZ8 9737/EDH9 9725 straddle strip at 49.5 (had settled 50.5 Friday). The entire strip of ED straddles lost 0.5 to 1.5 bps.
–USD continues to strengthen this morning with EUR at new recent low of 120.35. Negative for commodities, but also a headwind for stocks.
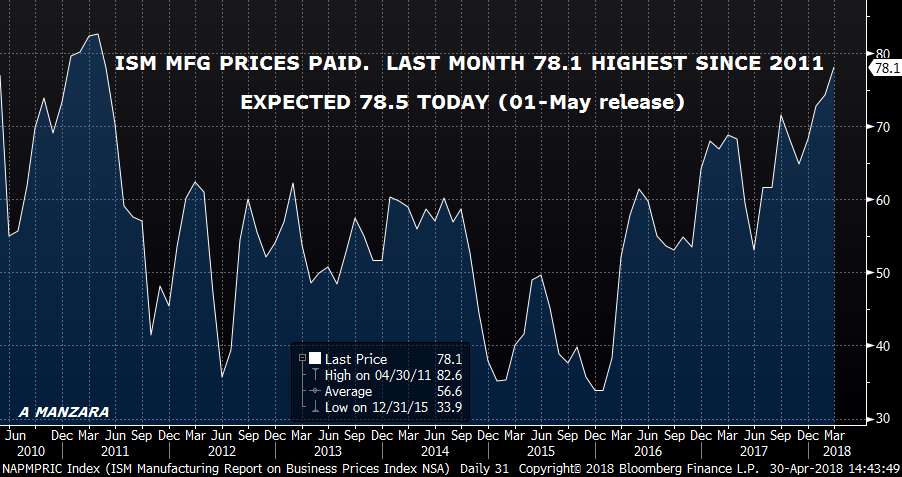
–Headline PCE prices hit the Fed’s 2.0 target, but yoy Core just missed at 1.9%. Today we get ISM Mfg, expected 58.6, which also include price data. As can be seen on the attached chart, last month’s 78.1 was the highest since 2011. Today it’s expected 78.5.
Supply Tantrum? Weekly, April 29, 2018
US Ten year yield tops 2% as Bernanke says Fed may taper buys
–Bloomberg headline on May 22, 2013, following Bernanke’s Congressional testimony. The start of ‘The Taper Tantrum’
”The program relates the flow of asset purchases to the economic outlook. As the economic outlook – and particularly the outlook for the labor market – improves in a real and sustainable way, the committee will gradually reduce the flow of purchases.”
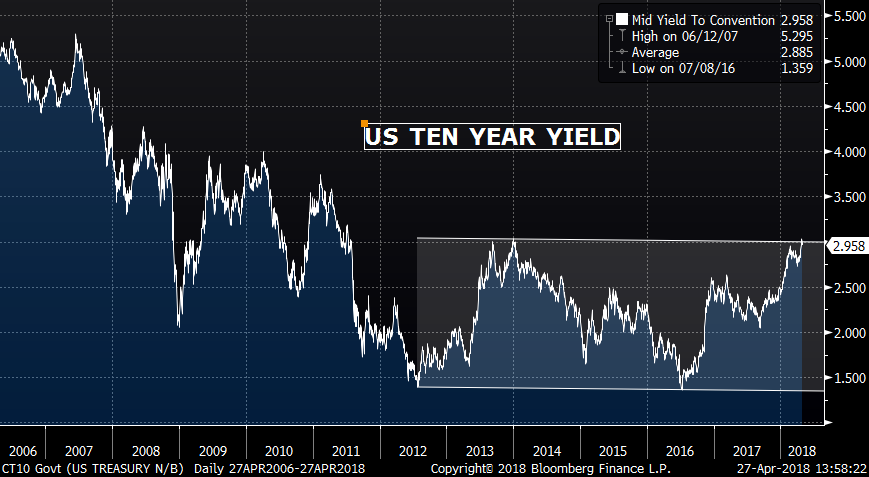
Just about 5 years ago, Bernanke sparked the taper tantrum on May 22, and added further fuel in the FOMC press conference of June 19. By the end of 2013 and into the beginning of 2014, the ten year yield had soared to just over 3%, a level that was finally revisited this week. As the chart below indicates, the yield level in the beginning of 2013 was quite low, 1.60% – 2.0%.
This week, the long round-trip to 3% was completed. Looking at the chart, one might be tempted to say we’re at the top of the range, time to sell. Indeed Citi did just that, recommending entry at 3% with a target of 2.65%.
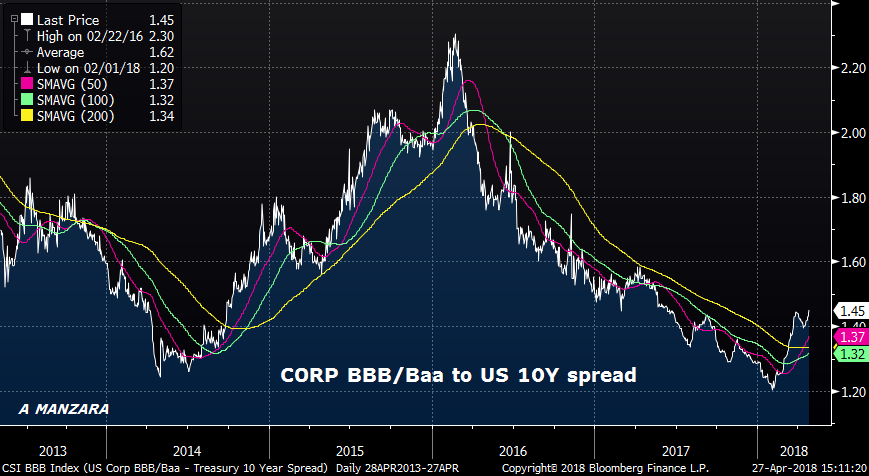
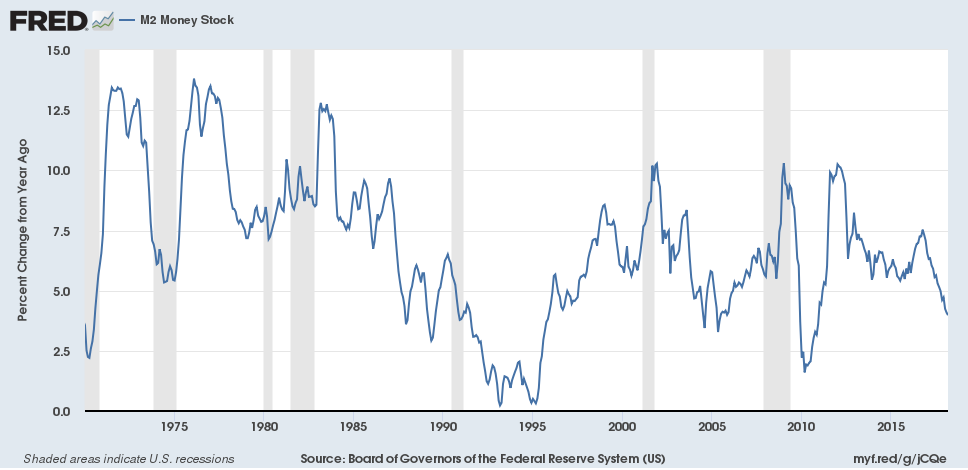
There are a lot of longer term indicators which suggest that yields SHOULD come back down. For example, yoy M2 growth has been falling consistently, suggesting a slowdown. Annualized growth has gone from a rate of 7.25% in September 2016 to just below 4% currently. (Chart at bottom). Commercial and Industrial loans tell a similar story. C&I loan growth peaked in Dec 2014 at 12.6%, versus the most recent mark of 2.6%. The low in November last year was a pace of only 0.5%. The tax bill with immediate capital depreciation and other stimulus is likely causing loan growth to bounce; the broader point is that some factors suggest economic deceleration. Additionally, while the early part of the hiking cycle was ironically associated with looser financial conditions, tightening is now becoming apparent across markets. Dudley relates financial conditions to short and long term rates, the value of the dollar, stocks, and corporate spreads. Both short and long rates have made new highs, while the curve has flattened. The dollar rallied this week and appears to have bottomed. Stocks have dipped. While junk bond spreads remain tight, flows into HYG and JNK etfs have slowed. Below is a chart showing BBB spread to treasuries and it has turned higher since the start of the year. (Corporate spreads may stay relatively tight just because of the vast amount of gov’t supply). Tighter conditions will take a bite out of forward growth.
However, there are many shorter term issues that will likely dominate the direction of yields in the near term, and many of those are bearish. For example, on Monday, PCE prices, which is the Fed’s preferred inflation measure, is released. Both headline and core are expected 2.0%, finally at the Fed’s target. Powell and many others have talked about calendar effects which will support inflation data going forward. Here’s a snippet from last year regarding mobile phone service prices: “Paul Ashworth, chief U.S. economist at researcher Capital Economics, recently explained ‘that nearly half of the decline in core CPI inflation this year can be traced to a single item: wireless telephone services’.” From the same article, “Per Labor Department statistics, mobile plan prices dropped nearly 9% between March and April, and since April 2016, service prices are down nearly 13 %.” These price drops are now falling out of inflation comparisons. Last month Core PCE Prices were 1.6%. On Monday, the expectation is 2.0%. If it hits, it will be the highest since 2012. Will the market shrug it off? Perhaps, but consider other factors…
First, WTI Crude closed around $68, near the high of the year. Last year in April it was around $50/bbl. On May 12, Trump will decide whether to continue suspension of sanctions on Iran. Renewed sanctions will likely be associated with a drop in global oil supply and even higher prices. Inflationary.
Second, everyone knows that employment data is generally strong. This was underscored by last week’s historic low in jobless claims of only 209k. ECI was +0.8 last week, more than expected. From Bloomberg: “Employment cost index rose 0.8% q/q (est. 0.7%); after 0.6% gain. Wages and salaries advanced 0.9% q/q; benefits costs climbed 0.7%. Total compensation, which includes wages and benefits, climbed 2.7% over past 12 months, strongest since 3Q 2008, after 2.6% gain. Private-sector wages and salaries advanced 2.9% y/y, also the largest since 3Q 2008, after rising 2.8%.” This Friday the Employment report is released, with NFP expected 190k and Avg Hourly Earnings +2.7% yoy.
Third, the treasury releases the quarterly refunding schedule this week. Supply is expected to be huge, and, as I mentioned last week, the amount of new cash simply associated with the 3, 10 and 30 year auctions next week starting May 8 is expected to be $33 billion out of the $72b to be auctioned. That money has to come from somewhere. How about a yield concession? This is probably childishly simplistic, but the Chinese may say, ‘why should we recycle our trade surplus into US treasuries so that the US can deficit-spend to build up its military? Why don’t we focus on building OUR military capabilities for control of the South Sea, etc.’
The point is that there are a lot of potentially bearish news items for bonds in the next two weeks. It wouldn’t surprise me to eventually get back to 2.65%, but I would say it’s more probable that 3.25-3.33% is reached first. The original taper tantrum caused a yield surge in tens from 1.60 to 3.00, a total of 140 bps. This year’s Supply Tantrum(p), could be marked by a yield move of similar magnitude. Last September’s low was just over 2%, so an increase of 140 bps would target 3.40/3.45. The 50% retracement from the high yield in 2007 of 5.30% to the low in 2016 of 1.36% is 3.33%.
Obviously a big break in stocks could shift the tide of funds into bonds. While Amazon reported blow-out revenue of $51 billion (+43% yoy), Nasdaq was nearly unchanged Friday. Big tech isn’t causing growth, it’s cannibalizing other companies. Additionally there has been notable weakness in financials, with many big banks just barely rebounding from late March lows (example, IYF, i-shares US Financials).
The treasury refunding announcement is on Wednesday morning at 8:30; the FOMC announcement is Wednesday afternoon. If the PCE price data are strong, then there could be a slight upgrade in language regarding inflation, otherwise there is little reason to expect a change.
OTHER MARKET THOUGHTS/ TRADES
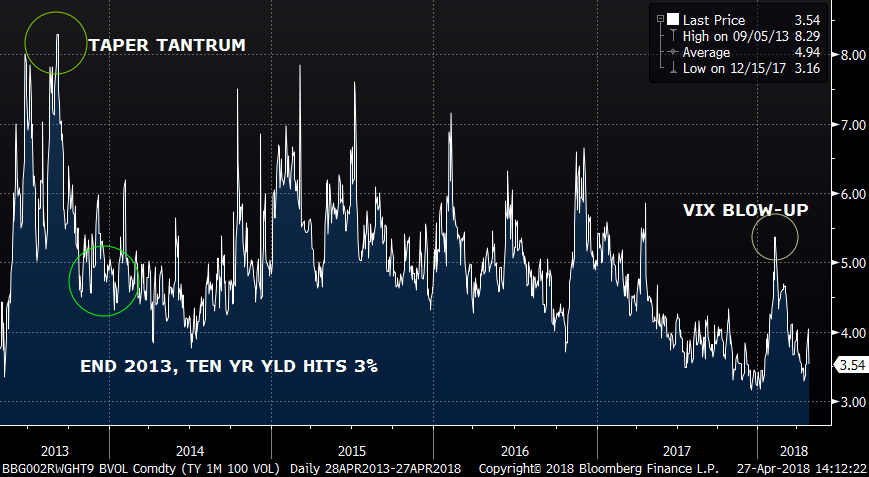
Week to week changes across markets were rather small. On the week, 10’s rose just 1 bp to 2.957. SPX barely changed. Same with crude oil. It’s no wonder that vol slipped. I include a TY vol chart which shows we are close to multi-year lows, a rather surprising reversal from the VIX blow-up earlier this year. I actually marked USU vol sub 7%. The USU put seller added to his position, and although underwater on the initial 143 put sales, the 139 puts sold last week at 1’23 to 1’20 settled at 0’61. Several analysts (DB, BAML) suggest that odds of a debt inspired crisis are increasing for the US. Of course, this would be a longer term, low probability event, but still suggests that implieds are too low in treasuries.
| 4/20/2018 | 4/27/2018 | chg | |
| UST 2Y | 247.5 | 248.0 | 0.5 |
| UST 5Y | 279.5 | 279.9 | 0.4 |
| UST 10Y | 294.7 | 295.7 | 1.0 |
| UST 30Y | 313.8 | 312.5 | -1.3 |
| GERM 2Y | -56.1 | -57.8 | -1.7 |
| GERM 10Y | 59.1 | 57.1 | -2.0 |
| JPN 30Y | 73.1 | 73.0 | -0.1 |
| EURO$ Z8/Z9 | 34.0 | 33.5 | -0.5 |
| EURO$ Z9/Z0 | 7.0 | 8.5 | 1.5 |
| EUR | 122.89 | 121.31 | -1.58 |
| CRUDE (1st cont) | 68.40 | 68.10 | -0.30 |
| SPX | 2670.14 | 2669.91 | -0.23 |
| VIX | 16.88 | 15.41 | -1.47 |
http://www.realclearlife.com/finance/mobile-phone-plans-unlimited-data-limited-inflation/
https://www.treasury.gov/resource-center/data-chart-center/quarterly-refunding/Pages/Latest.aspx
April 27. Q1 GDP today. Stocks have muted response to good earnings
–General rebound in markets yesterday, with stocks rising on light volume and the ten year yield edging back below 3%. (closed 2.99). There continues to be selling of USU puts, with new sales yesterday of 139 puts at prices of 1’20 to 1’23. The initial sales of the 143 puts were at the same level ref 145-18ish. USU 143 puts settled 3’09 and 139 puts settled 1’19 vs US 141-17. The recent rally in vol was erased.
–Jobless claims were only 209k, extremely low.
–Today’s news includes ECI expected +0.7 and Q1 initial GDP estimate, pegged at 2.0 with Prices +2.2. Atlanta Fed GDP Now is also at 2.0 and NY Fed’s Nowcast is 2.9.
–As mentioned in yesterday’s comments, the big US to German yield curve 5/10 yr spreads appears to have been an exit of 10y US/Bund spread, and moved up the curve to FV vs Bobl. As shown on the chart below that spread is at a new high of 284.
–Once again there was a late seller of 40k EDZ8/EDZ9 spread at 34.5, which is where it settled. The other day there was a good size block sale at the same level which was an exit.
–The other aspect of yesterday’s trade was a breakout of EURO, where USD is strengthening. DXY now nearing the high of this calendar year. Likewise with EUR which was 121 at the end fo the day. Next big support is 200 dma at 120.08.
April 26. Why didn’t you just sell EUR?
–The big trade yesterday was the massive US 5/10 buy vs Bobl/Bund sale.
- buy 100,174 US five-year treasury futures
- sell 63,887 US ten-year treasury futures
- sell 65,362 German bobl futures (5-year)
- buy 29,145 German bund futures (10-year)
–According to prelim figures, open interest in US 5y was +114k. However, in tens it was DOWN 15.6k. I thought position was new… In any case, the shock waves of this trade reverberated into the euro$ curve as well, with red to deferred calendars making new highs. For example, red/gold pack spread (2nd to 5th year) was up 2.375 bps to 20.125, new monthly high and a pretty solid bounce off last week’s low of 8.25. EDZ0/EDZ1 rose 1.5 to close at 4.0, having threatened to invert last week.
–The other story is that US yields continue to rise, with tens closing above 3% (3.024). While stocks have seen a modest bounce since Tuesday’s sell-off, the fact is that yields are getting to the point where they are much more of a competitive threat to stocks. Shift into fixed income, ‘get paid to wait’. Of course, the avalanche of supply may provide better entry levels in FI as well, which creates incentive to favor the short end, another factor which supports the steepener.
–Of course, euro$ contracts are also pressing to new lows with EDM8 9760.5 settle, and FFF9 at a new low of 9774.0, 56 bps above the current Fed Effective.
–Today’s news includes the ECB press conference, with Durables released in the US, expected +1.7 with Core Capital Goods +0.6. Trade balance -74.5b, Jobless Claims and 7 year auction.
April 25. Flirting with 3% as asset values erode
–There’s a lot of attention focused on the 3% level in ten year notes, but I am still watching 2.87 as major support in fives as well. 5y auction today; w/i was 281.5 at futures settlement. Though rates were little changed by day’s end, the curve was modestly steeper, and the dollar shows continued signs of a bottom. Big trade in euro$’s yesterday (against the 3% level) was a buyer of 100k 3EM 9700/9725cs vs 9662.5p for 3 to 4 bps. EDM1 is the underlying, which settled 9694.0. High correlation to 10 year yield, for example on April 3, TYM settled 120-27 with cash yield 278.3. Yesterday, the ten year yield was exactly 20 bps higher at 298.3 (119-10+) and EDM1 was also exactly 20 bps higher at 9714.
–Another interesting trade was a seller of 3k USU 141^ (4’52s) vs +3x 146/151cs (0’40s). If same as the 143p short, he continues to add longs with open ended put exposure. The question now is whether weakness in equities will spill over into a bid for fixed income in the face of supply and deteriorating corporate credit quality. There’s a piece on BBG this morning outlining concerns: “Notes in the lowest rungs above high-yield junk — in the BBB group from S&P –total about $3 trillion.” “The high-grade bond market in the U.S. already has the lowest credit quality mix since the 1980s, according to CreditSights…”
https://www.bloomberg.com/news/articles/2018-04-25/a-3-trillion-credit-market-has-corporate-bond-investors-on-edge
–There continues to be short covering of wing calls in dollars, for example, EDM8 9812c 0.25 paid 80k (OI -42k) and 2EM 9787c 0.25 paid for 80k as well with OI down 28k. There was a block seller of 23k EDZ8/EDZ9 at 35.0 (exit). Settled at 34.0, having been as high as 36.5 early in the day. I would say that the theme is uneasiness with respect to further downside in stocks, and positions are being pared accordingly.
–One week from today is an FOMC meeting. No change in rates expected. No press conference. But there may be some clues in terms of economic slowing. Today features auctions of 2y FRN and 5y note. FB reports after the close (ruh-roh).
April 24. Stopped short
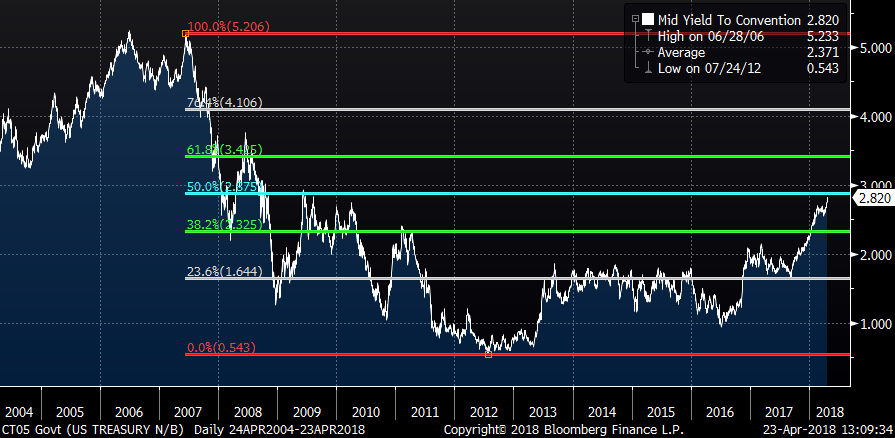
–The ten year note yield stopped just shy of 3% yesterday, and as shown on chart below, the 5 year yield is within a few bps of the 50% retrace between the 2007 high and 2012 low (2.875). However some ED contracts still made new lows, and near FF contracts did as well. For example, FFN8 closed at 9807.5 or 1.925%. The Fed effective is currently 1.69%, so July is only 1.5 bps from what would be the new rate when the Fed hikes at the June FOMC. Jan’19 FF closed 9874 or 2.26%, with odds of 3 more hikes into year end steadily increasing. Near euro$ calendar spreads posted new highs, with EDM8/EDM9 at 48.5, up 10 bps in the last 7 sessions. EDZ8/EDZ9 closed 35, also a recent new high, with strong resistance at 38.5.
–Two year auction today. Between the 2,5, 7 and 2y FRN auctions there’s just under $110 billion being auctioned in 3 days, however the new cash raised (according to TBAC) is just $5.6 billion. Worth noting however, that 3, 10 and 30 year auctions next month total $72 billion with only $39 b maturing, so $33 b in new cash. THAT will be a test.
–Dollar strengthened to a new 3 month high yesterday and appears to have found a longer term base.
–Exit buyer of 150k EDM8 9825 c yesterday for 0.25. I believe this covers the short leg of the 9800/9825 c 1×2 that was bought vs 0EM 9800c. Both EDM and 0EM 9800c also closed 0.25, but the general theme of the trade continued to be placed using lower strikes and moving into July maturities.
–New Home Sales and Consumer Confidence this morning, followed by 2 year auction. One more comment about upcoming auctions. I had seen a paper by a bank expecting the tax package to cause continuous buying in longer dated assets to fill underfunded pension plans. It was a fairly bullish thesis. However, supply of debt (both corporate and government) still seems to have the potential to overwhelm this demand.
April 23. 3% tens
–An article on Bloomberg (What Global Finance Chiefs are Saying About the Economy) repeatedly cites concerns about a trade war. Mnuchin floated the idea of a visit to China, which should alleviate some of those fears, yet stock futures are slightly lower this morning after a weak performance on Friday. The ten year note is at a new low, just under 3%.
–Tens closed Friday at 294.7 (+3.5 bps) but then edged higher after the futures settlement. Twos and fives made new highs for the move. The 5y note is approaching the 50% retracement from the high yield in 2007, 5.206% to the low in 2012, 0.54%, which is 2.87%. Friday’s close was 2.79. Odds for three more Fed hikes are increasing, with January Fed Funds trading as low as 9774.5 this morning, 56.5 bps over the current Fed Effective of 1.69%.
–Friday featured new recent highs in near one-year euro$ spreads, with the peak EDM8/EDM9 at 46.5 bps. EDU8/9 also posted a new high at 41.5. The highest a one-year spread has traded this cycle on a constant maturity basis is just over 60. Heavy buying Friday of both EDH8 9675p and 0EU 9675p for 1.5 (75k) and just under 3 bps (30k) on Friday. To pierce that strike in March would require hikes at every quarterly meeting, (including next March).
–Today’s news includes Chgo Fed National Activity Index, expected 0.29 vs 3m average of 0.37, Existing Home Sales, and PMI Composite expected 54.6. Also, Sohn Conference is occurring, which usually elicits strong investment themes.
April 22, 2018. Pressure and Time
Geology is the study of pressure and time. That’s all it takes, really. Pressure…and time.
–Ellis Boyd ‘Red’ Redding (Shawshank Redemption)

Might paraphrase that and say inflation is the product of pressure and time. That’s all it takes. I’m not quite sure that’s all it takes, but it does seem as if all the concern about not being able to reach the inflation target is in the rearview mirror. Even Kashkari said, “I think it’s likely that fiscal actions that have been taken are going to on the margin help us achieve our inflation target.” Other Fed officials are saying there isn’t likely to be an inflation ‘breakout’, as if they’re harboring concerns of an overshoot.
There are often commentaries that say rates CAN’T go up because there’s no wage growth, and that the economy can’t possibly withstand higher rates due to over-indebtedness. The underlying premise seems to be that a boom/bust cycle has simply gone by the wayside. As the President likes to say, “We’ll see.”
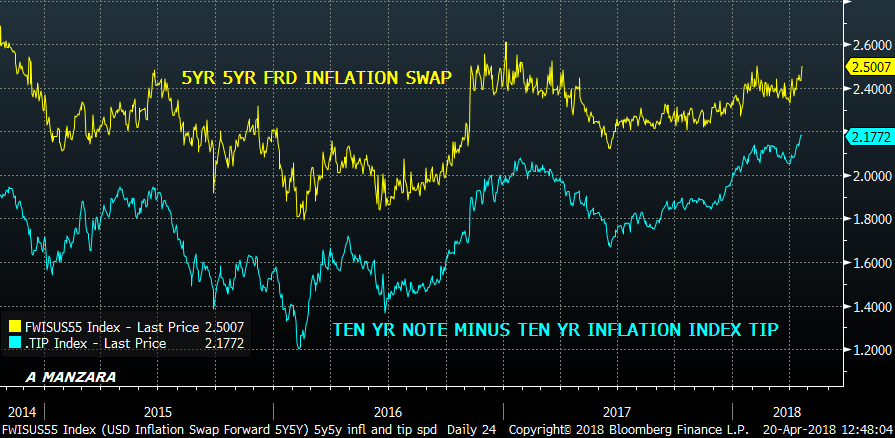
For now I am simply going to post a few charts that I find interesting, and attempt to weave some stories together. The first chart features a couple of ‘market based’ inflation measures, the ten year tip breakeven rate and the 5y 5y forward inflation swap. Both have been generally increasing since the middle of last year. As previously mentioned, I don’t put much faith in the tip breakeven, however, other inflation price measures are also increasing, including the NY Fed’s UIG (Underlying Inflation Gauge), which is last at 3.14 for the ‘full data set’ and at 2.23% for the ‘prices-only’ measure.
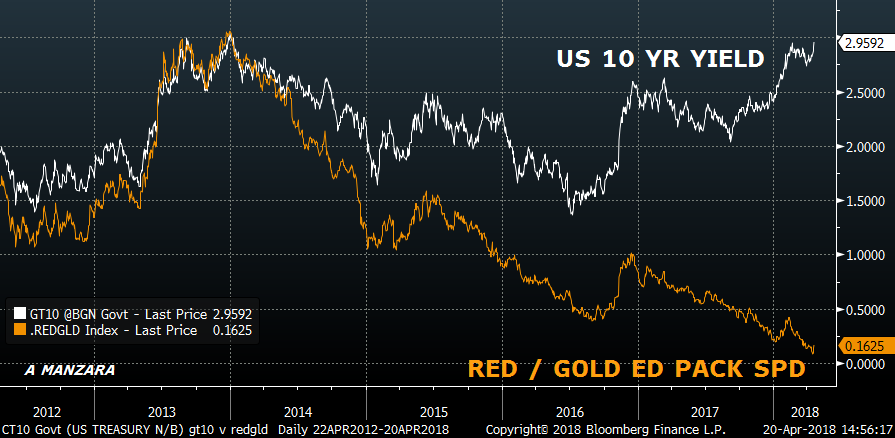
The next chart is of a slightly longer time-frame, going back to 2012. This chart overlays the ten year treasury yield, which hit a new high this week of 2.96%, with the red/gold (2nd year to 5th year) Eurodollar pack spread. What is interesting about this chart is that in 2013, when the taper tantrum occurred, these two measures traded in lock step. Both topped right around 3% at the end of 2013. Since then however, with the exception of the post-election spurt, red/gold has declined, having posted a new low last week of 8.25 bps, just under the previous tightening cycle low (10.25 in ’06). It’s quite a change, though easily explained away. In 2013 the fear was a massive withdrawal of Fed bond buying, not the idea of constant Fed Fund tightening. Now, Fed hikes have flattened the curve and caused general rate rises, while increased government supply is starting to seep into the market’s consciousness. But this chart still displays a fairly large dislocation, and as I showed a couple of weeks ago, the flattening curve this year has been associated with a weaker US dollar. Eventually, yield differentials will cause dollar shorts to pare back positions, and comments by both Carney and Draghi tempered the idea of more restrictive (relative) policy, with Draghi saying “Notwithstanding the latest economic indicators, which suggest that the growth cycle may have peaked, the growth momentum is expected to continue.” Not exactly brimming with confidence, and the euro closed near the low of the past three month’s range.
I would further note that the market is pricing near term Fed hikes fairly aggressively already, with a June hike at over 90% (July Fed Funds are 98.085 or 1.915% vs current Fed Effective of 1.69, a spread of 22.5). Aug/Oct FF spread isolates odds of a September FOMC hike; that spread is 17.5/18.0, which represents over 70% chance of a move at that meeting. And November/January FF spread is 11.0/11.5, putting December near 50/50. On top of that, there was a buyer of 100k EDH9 9675p Friday for 1.5, suggesting risk of an even steeper hike trajectory.
So if near term contracts are making new (price) lows, and longer term yields are making new highs at the same time, then flattening may have run its course. Indeed, the end of the week featured a solid bounce in the curve. Further, 2 and 5 year notes are nearing technical resistance at 50% retracement levels from the 2007 highs to 2012/13 lows. In the 2y, the high was 5.10% and low 15 bps, so 50% is 2.625 vs current 2.455% (w/i 2.475) and the 5y high/low is 5.206% to 54 bps so halfway is ~2.87% vs current 2.795%. Longer dated contracts have room to run with 50% in tens at 3.33% vs current 2.96.
The next chart is one I trot out every so often, SPX priced in terms of commodities. I use SPX divided by the Bloomberg Commodity Index. For a long time, financial assets have been favored over ‘things’. Now, a four-year long upward sloping trend line has broken, was re-tested, and the price is near the low of 2018.
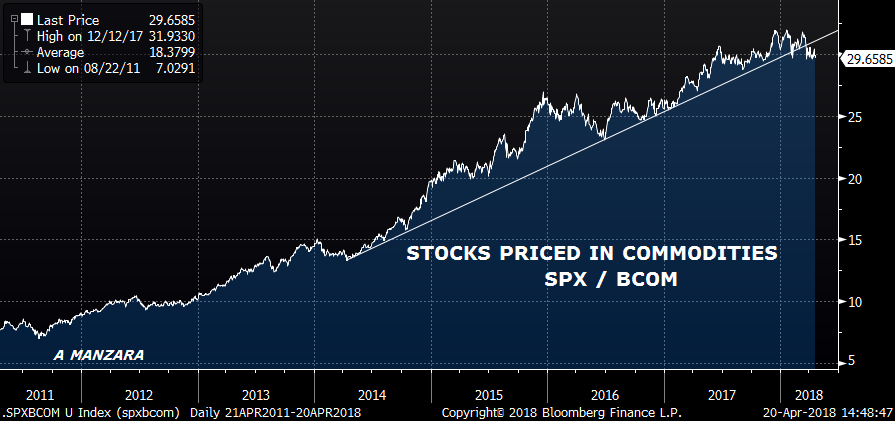
Most commodity indexes are heavily weighted with oil, and BCOM is no different, though the energy component dropped slightly in 2018 to 30.57%. Oil prices continue to rise, but I would also note that precious and industrial metals comprise over 33% of the index, and cite this from the Credit Bubble Bulletin: “Silver rose 3.0% this week, with Palladium up 4.2%, Aluminum 8.1%, Zinc 3.7%, Nickel 6.4%, Tin 3.2% and Copper 2.8%.” Some of these price increases are related to Mideast tensions, some to trade tensions. How much pushes through to inflation? Not sure, but both Gundlach and Gross have talked about favoring commodities as a late cycle play, and this chart captures that sentiment, favoring commodities over tech stocks.
The last topic is China, which is further in the news this weekend as Treasury Secretary Mnuchin floated the idea of a visit to smooth trade tensions. It’s likely that such a trip would result in the Trump administration being able to victoriously claim concessions, and perhaps stocks will bounce at the start of the week in a vote of confidence. However, larger concerns for China are probably centered on military control of the South Sea (grant a few trade benefits in exchange for non-interference), and its own domestic economy and debt imbalances. Last week the PBOC cut RRR by 100 bps. The chart below shows the Li Keqiang Index at a 2 year low, and a near 50 bp decline in the ten year government yield from 4% to 3.52%. China forecasts growth of 6.5%, but these indicators suggest that target may be hard to hit. One might also conclude that China’s support for the US treasury market may erode further.
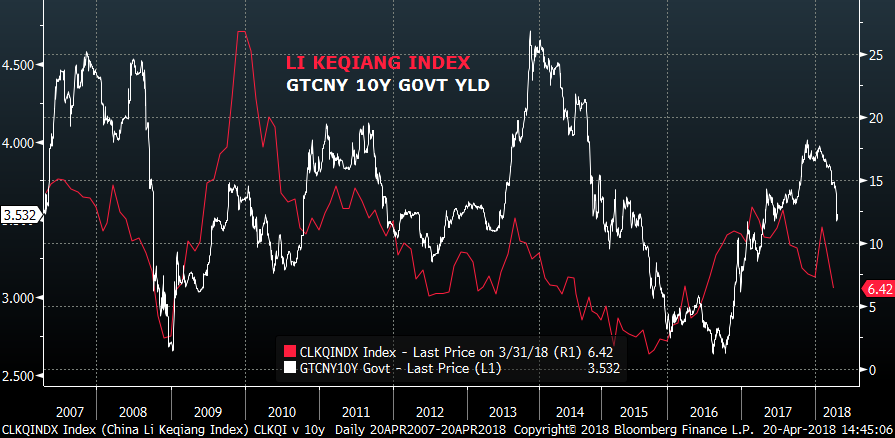
From Wikipedia: Li Keqiang (then the Party Committee Secretary of Liaoning) told a US ambassador in 2007 that the GDP figures in Liaoning were unreliable and that he himself used three other indicators: the railway cargo volume, electricity consumption and loans disbursed by banks.
In summary, US inflation, sparked by the weaker dollar and Trump policies, will likely retain forward inertia. Although relative rate perceptions should cause stabilization or an outright rally in the dollar, commodities will still outperform stocks. The front end of the US curve has been significantly priced for rate increases; weakness in the long end is likely to become the focus.
This week features auctions of 2, 5 and 7 year notes starting Tuesday.
We’ll get Q1 advance GDP on Friday. Atlanta Fed’s GDPNow stands at 2.0 and NY Fed’s Nowcast at 2.91%.
| 4/13/2018 | 4/20/2018 | chg | |
| UST 2Y | 236.1 | 245.3 | 9.2 |
| UST 5Y | 266.7 | 279.0 | 12.3 |
| UST 10Y | 282.1 | 294.7 | 12.6 |
| UST 30Y | 302.5 | 313.8 | 11.3 |
| GERM 2Y | -58.2 | -56.1 | 2.1 |
| GERM 10Y | 51.1 | 59.1 | 8.0 |
| JPN 30Y | 69.3 | 73.1 | 3.8 |
| EURO$ Z8/Z9 | 30.0 | 34.0 | 4.0 |
| EURO$ Z9/Z0 | 4.5 | 7.0 | 2.5 |
| EUR | 123.31 | 122.89 | -0.42 |
| CRUDE (1st cont) | 67.39 | 68.40 | 1.01 |
| SPX | 2656.30 | 2670.14 | 13.84 |
| VIX | 17.41 | 16.88 | -0.53 |
April 20. News cycle latches on the flattening curve; time to exit
–A couple of quick takeaways from yesterday’s price action. Stocks and bonds went down together. Also, implied vol firmed (albeit slightly) in fixed income as yields rose and the curve steepened. Typically, sell offs haven’t been associated with demand for premium. The highlight is the short USU 143p position (36k), which is now at the money, having settled 2’24 vs 142-30 (vol 7.0, vs initial sales sub 6.9). It also put the first sales of 12k at 1’21 just over 1 point under water. The ten year yield rose 4.8 to 291.2, while the 30y bond was up 6.2 to 310.5. German bund ended near 60 bps, having spent the early part of the month between 50 and 52. The red/gold eurodollar pack spread rose 4 bps to 13.375, having made new lows this week of 8.25. Now that every financial publication under the sun is opining on implications of a flattening curve, it’s ripe for a bounce.
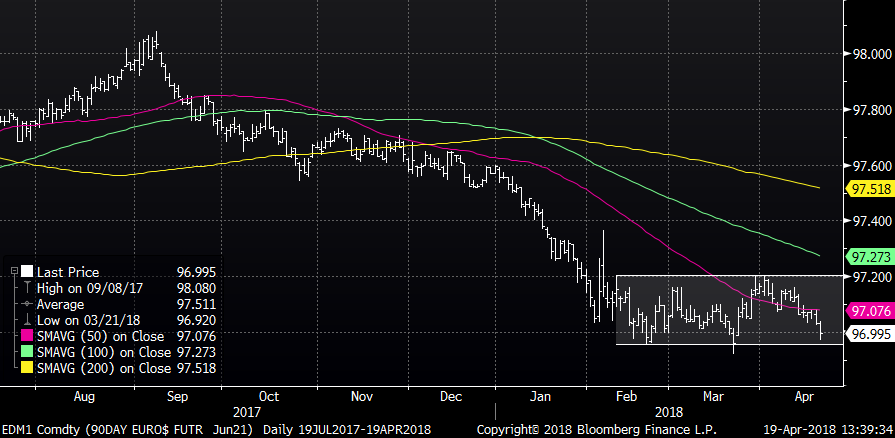
–Large early sale of 0EM (short red June midcurve) 9700p at 2.0. Settled there vs 9717.5, with a decline of 50k in open interest. On the call side, buyer of 40k TUN8 106.5/106.6 c spd. Sept 2y settled 105-272, so the lower strike is at least 30 bps away. There was also massive buying of 3EK (blue May) 9712.5c for 2.5 vs 9701 down to 9699.5. Settled 2.25 ref 9699.0 with a jump in open int of 59k. Late buying of 20k TYK 120c for 3 ref 119-26; May treasury options expire today.
April 19. Higher oil, higher commodities, higher rates
–Crude oil and commodities are getting a larger role on the financial stage as CLM8 approaches $70/bbl (late yesterday was 68.80, +2.28, and this morning traded well above 69). While primarily due to Saudis wanting a higher price, a BBG article notes that BCOM (Bloomberg Commodity Index) has broken out to a new high today. Could a small contributor also be that China cut its reserve requirement ratio on Tuesday by 100 bps? I saw some commentary saying it was NOT a change in policy stance, but a cut is a cut.
–Yields pushed higher across the curve yesterday with tens rising 5.2 bps to 286.4. Curve edged slightly steeper from its flat configuration. While not particularly important in terms of an indicator, perhaps worth noting that ten year treasury to inflation index note is at a recent new high of 216.5 bps.
–Dudley yesterday said that a gradual pace of tightening is still appropriate, though noted inflation still below target. Fed funds market is suggesting that 3 more rate hikes this year are becoming more probable. For example, FFF9 closed 97.77 or 2.23% vs current Fed effective of 1.69, so 54 bps. That’s a new high in the spread, and, of course, anything over 50 is a push towards 3 more hikes.
–While curve in general was steeper, I marked 5/30 at a new low of 31.4 bps. There is a continuous seller of USU 143 puts, another 12k yesterday, bringing total position to around 36k. At USU settle of 144-03 these puts are only about 5.5 to 6 bps out of the money. Other trades of note: buyer of 50k EDM8 9762p 0.625 to 0.65 (cover short). Seller 90k 3EM 9762p just over 2.0 (exit of long). And a new buyer of 20k 2EZ 9675/9650p 2×3 for 6, covered 06.5. Settled 10.75 and 5.25 so 5.75 in the 2×3 ref 9706.5.

