April 18. Flatten curve, sell vol – repeat
-Once again new lows in the curve with 2/10 treasury spread at 42.5 bps and red/gold pack spread down to 8.25 bps. Beige Book is released this afternoon, and while it’s likely to indicate continued growth, the back end of the curve questions the sustainability. The Beige Book is in preparation for the May 2 FOMC meeting, where nothing is expected as May FF contract trades 9831.0, exactly at the current 1.69 Fed Effective rate. However, the July FF contract at 9809 suggests around 90% odds of a hike at that meeting, and Jan’19 FF at 9779 is 52 bps higher than the current FedEff (suggesting 2 more hikes are a lock).
–The market appears very comfortable with this idea of 2 or 3 more hikes for the year, which makes for a flatter curve and a decline in vol. Premium sellers on display right from the open with new sales on EDZ19 underlying: About 10k 0EZ 9712^ sold at 37.5 (settled 37.0, -1.0 on the day), and EDZ9 9712.5^ vs 9812c sold at 49 to 48.5 in 15k. These premium sales are extending out to the longest maturities, with notable action in Sept bond options. There has been a consistent seller of USU 143 puts (open interest now 24k) and 150 calls. Total OI in Sept bond options now near 70k, a huge amount for this time in the cycle and well above TYU options. US implied is just 6.6 in June and 6.8 in Sept. (USU 145^ 4’42s).
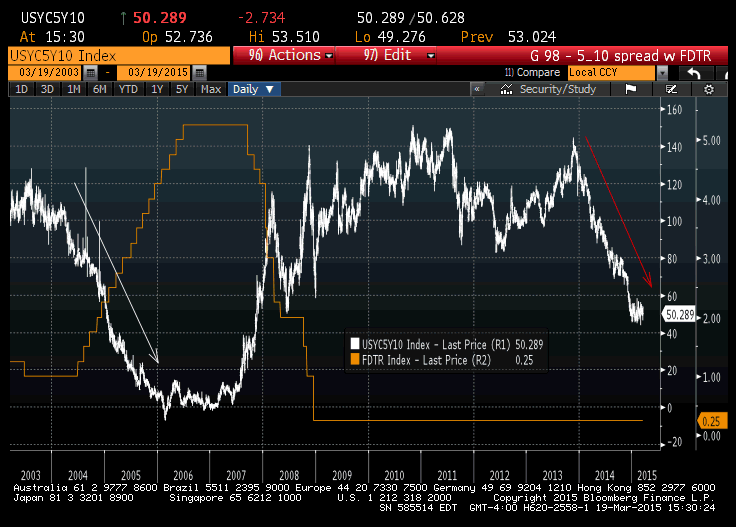
5/10 treasury spread and the nominal level of rates
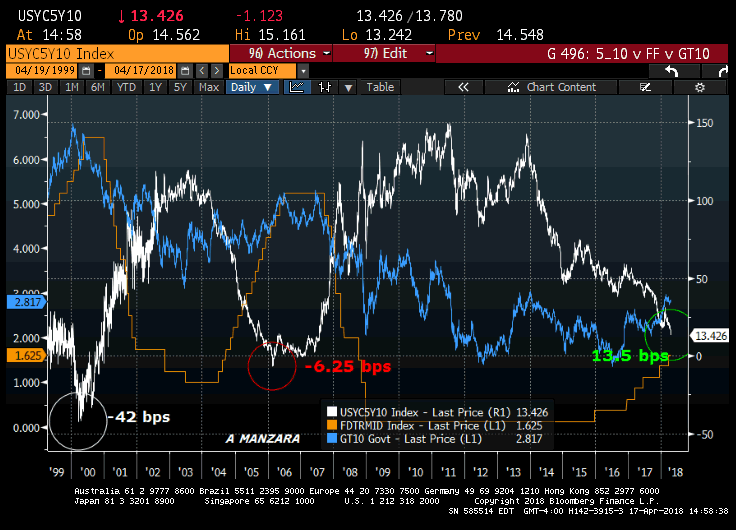
Below is a chart with 5/10 treasury spread (white) FF target (amber) and Ten yr treasury yield. In 2000, 5/10 bottomed at MINUS 42 bps (as FF were on the way to 6.5% and UST 10yr yield was close to 7%). In the 2004/2006 hike cycle the spread got to MINUS 6.25 bps, but both FF and UST topped out at a lower level than the previous cycle, (both at 5.25%). The curve is again breaking down; it APPEARS as if the Fed is nearing the end of the hiking cycle.
5/10 is 13.5 bps, with Fed Effective at 1.69% and 10y at 2.82%. At these lower nominal yields, it doesn’t seem as if 5/10 should have as much potential to invert to the same extent as previous episodes. Not that I would call this a ‘buy’ signal; indeed red/gold ED spread HAS eclipsed the low set in 2006. It’s only that additional flattening will likely be much more of a two-way grind.
April 17. Does the curve mean anything?
–“The level of attention to the recent and mild inversion of the yield curve has bordered on hysteria in the media. Does it portend a recession? Or is, as Ethan Harris, the chief economist of Lehman Brothers suggests, the bond market simply on drugs?” A clue that this quote isn’t current comes from the Lehman reference; it’s actually a quote from John Mauldin from December 2005. The last Fed hike cycle was from mid-2004 to mid-2006, and the curve inverted at end 2005 or the start of 2006. (As an added kink, in the years from 2002 to late 2005, 30 year bond auctions were suspended; resumption was announced in August of 2005). GDP grew but decelerated in 2006 and 2007. Stocks didn’t put in the highs until late 2007. Lehman closed.
https://www.mauldineconomics.com/frontlinethoughts/the-yield-curve-mwo123005
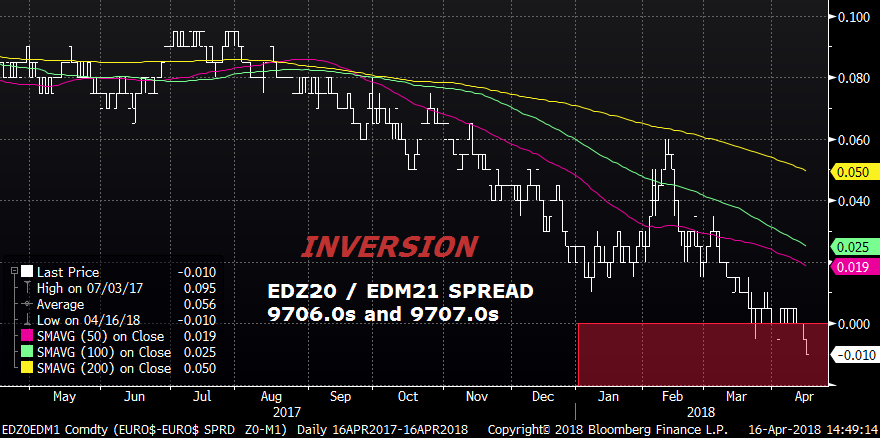
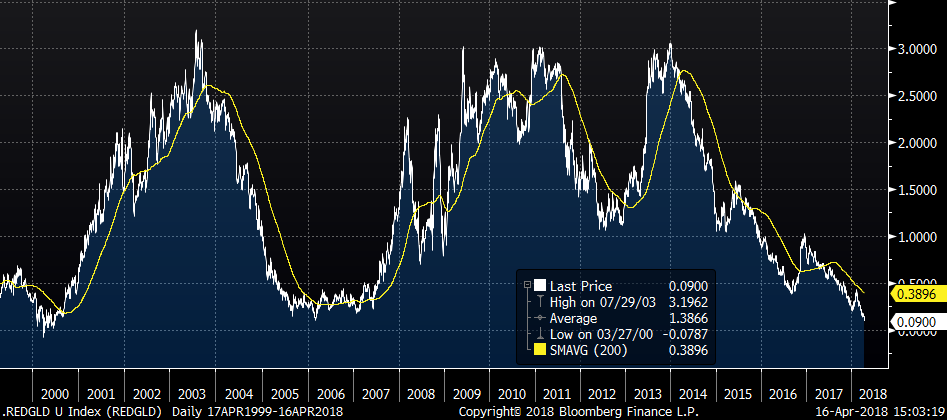
–Yesterday, the back end of the eurodollar curve saw continued minor inversion. It doesn’t appear as if the flattening trend will change as long as Fed officials studiously ignore negative ramifications. A couple of charts below, EDZ20 to EDM21 closed at -1.0 (9706 and 9707). Red/gold pack spread settled at a new low of 9.0, below the 2006 low but above the low of 2000. 5/10 at 15 bps; 10/30 at 20 bps.
–There was an early buyer of 35k EDZ8/EDZ9 spread at 31.0 (settled there) appears to be new. EDZ9 continues to be the peak of open interest in dollars at 2.166m contracts. EDM8/EDM9 settled 42, +2.0 on the day, helped in part by a large buyer of 0EM 9712.5p, paying 5.0 ref EDM0 9720.5 early and then 4.5 covered 22 late. Open int rose by 27.5k; this put is the peak midcurve open interest at 606k (33 delta). In spite of some put buying, vol edged lower. For example, 2EM 9712.5^ went from 22 Friday to 21.5 yesterday, and TYM 120.5^ settled 1’06 or 3.5.
–A lot of Fed talk today: Williams at 9:15, Quarles at 10:00 (semi-annual House Fin Services testimony), Harker at 11;00 and then Chicago’s Evans to wrap it all up in a dovish package at 1:40. (Dudley yesterday reminded us that financial conditions remain quite accommodative). Retail Sales solid yesterday at +0.6, today brings Housing Starts and Industrial Production, expected +0.3.
–Top chart EDZ0/EDM1, 6 month spread. Lower chart red pack to gold pack in Eurodollars (2nd year to 5th year).
April 16. No escalation. For now.
–Markets are responding with relief that Friday’s strike on Syria seems to be contained. Oil has pulled back from new highs set Friday and stocks have bounced as bonds eased. Consequences aren’t always immediate.
–Friday featured new lows in the curve, with the red gold pack spread -3.75 to 10.875, a test of the low from 2006. The red to green pack spread (2nd to 3rd years) closed at 7.0 bps. The green to blue pack spread (3rd to 4th years) closed at just 1.625 bps. EDZ0/EDH1 remains inverted at -0.5. In treasuries, the 5/10 spread is 15.4 bps. EDZ8/FFF9 closed at 40.0, up 1 on the day, an indication that libor problems are not likely to recede.
–Today’s news includes Retail Sales, expected +0.4 after having hit a soft patch in the past few months. Bostic speaks at 1:15. TIC data at the end of the day may be important to gauge foreign demand for US bonds. May treasury options expire Friday.
April 15, 2018. The tipping point
A lot of economic theory is concerned with what happens at the margin. How do we determine ‘the tipping point’, the time when critical mass sparks a change?
I saw a headline ‘Boeing shares slide after Russia threatens to halt titanium sales’. I’m not sure if that particular story correctly pegged the price action, but Boeing was down 2.4% Friday, when both Nasdaq and SPX were down around 0.5%. I started to think about how much the modern world takes the idea of ‘availability’ for granted. Some things simply aren’t in endless supply (except for treasury bonds). Below are a couple of charts associated with electric vehicle batteries, lithium and cobalt, which both hit the tipping point around two years ago. Cobalt has gone from 25000 to 92000 over the last two years, and Lithium from 100 to 290 in the past 2.5 years. Apparently, about half of the world’s cobalt comes from the Democratic Republic of Congo, which has a bad record concerning child labor in the mines. Like everything else, there’s a touch of grey that seeps into every green story.
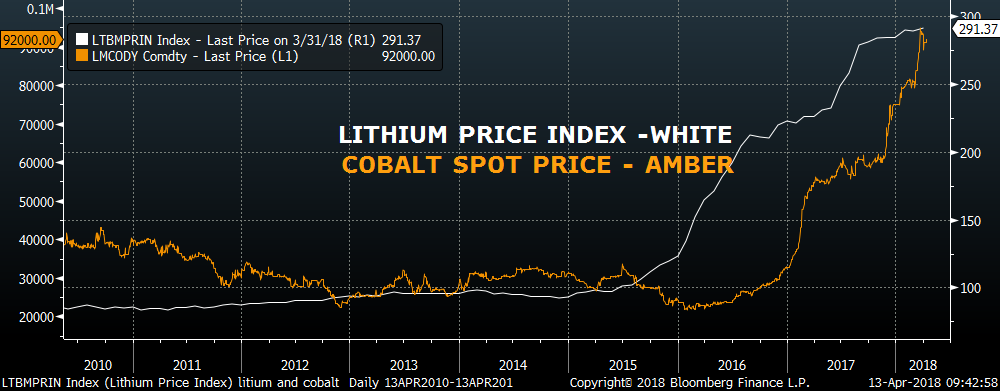
These prices on their own don’t have a lot to do with global interest rates. As the market ‘works’ we expect higher prices to encourage new supply and alternative technologies. However, aluminum also surged in the past week. And of course, crude oil ran up to a new high, and probably has more to go given events in the Mideast. Last week I mentioned the record net spec long in oil. Sometimes, the crowd is right.
The week ended with a bang, as the US, France and UK launched strikes on Syria’s chemical plant facilities. Whether this operation provokes unimagined consequences remains to be seen. I suppose the ‘Mission accomplished’ tweet could be taken as a signal to the Russians of one and done. I view this attack as a serious escalation, coming at a time when global trade tensions are on high alert, and divisions within the US government are on daily display. If there were ever fears of breaks in the supply chain that can spark price dislocations, the ingredients are all here.
The markets had closed prior to the Syrian bombings. Often it’s hard to get a handle on all of the news and idiosyncrasies that occur in a given week, especially now. But interest rates are telegraphing some pretty clear signals. The curve closed out the week at new lows, perhaps helped along by Rosengren repeating that the Fed may have to be more aggressive than expected due to tight labor markets.
The 2/10 treasury spread (at futures settlement) closed at 46 bps, and 5/30 at 35.8, both new lows. More stunning was red to gold Eurodollar pack spread, which settled 10.875 (-4.875 on week), essentially at the low of the 2006 hiking cycle. Newsflash to Mr Rosengren, the curve is NOT telling us the economy is about to run ‘hot’. Swipe left, this is pretty much the opposite of hot. There’s no inflation premium, there’s no curve. There’s no fear (for now) that the tsunami of treasury issuance will lead to higher rates as these sales are absorbed by …by who? The market is acting as if Central Bank buyers are ready to climb back in. That’s not to say that inflation won’t accelerate; every passing day brings the probability of an inflation overshoot closer. It just might be in the context of general economic malaise made worse by the continuous rise in dollar funding costs represented by libor. EDM8 settled 9762.0 or 2.38%, 2 bps above the US 2Y treasury yield of 2.36%. (Thanks YZ).
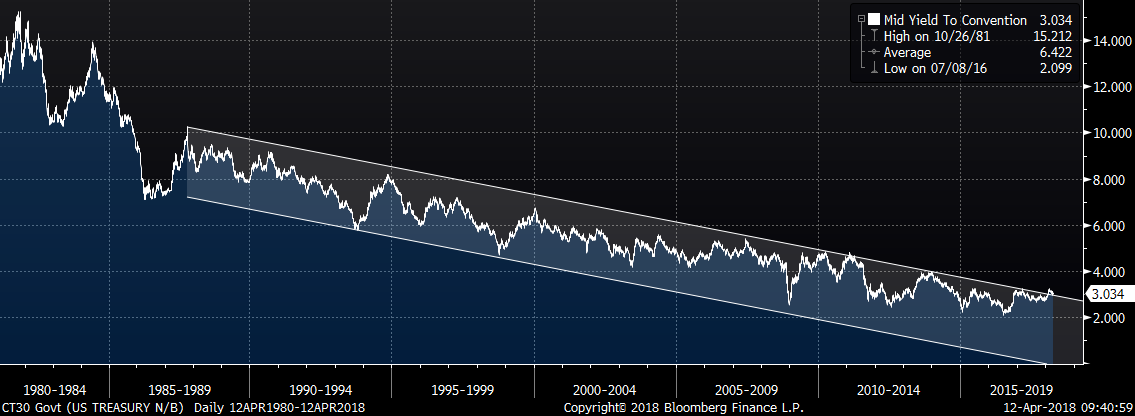
I recall listening to a competitor’s sales pitch a long time ago, Andy Tottman, who earnestly asked the client, “Wouldn’t you like to own bonds at 5.50%?” (The yield at the time was below that level) and he continued, “Just sell these puts. If the market gets down there you’ll own bonds at that yield!” Anyway, that advice echoed this week, and someone thought it would be a good idea to launch 12k USU 143 puts at a premium of 1’21 as USU was trading around 145-18 on Wednesday. Call it 2 1/2 points out of the money or maybe 13.5 bps, and additional premium of 7 bps, as the current 30 year bond yield was just over 3%. What prompts a cheap (vol under 7%) sale in a maturity that has no open interest? “HEY, maybe I can lock in 3.25% yield on US 30’s!” Or maybe it’s just this: Yields cannot go up. Premium should be sold. The Fed’s going to kill the economy. By the way, the 30 year JGB sank this week to a new low just under 70 bps, lowest in 1.25 years.
Below is a long term chart of the 30 year bond yield.
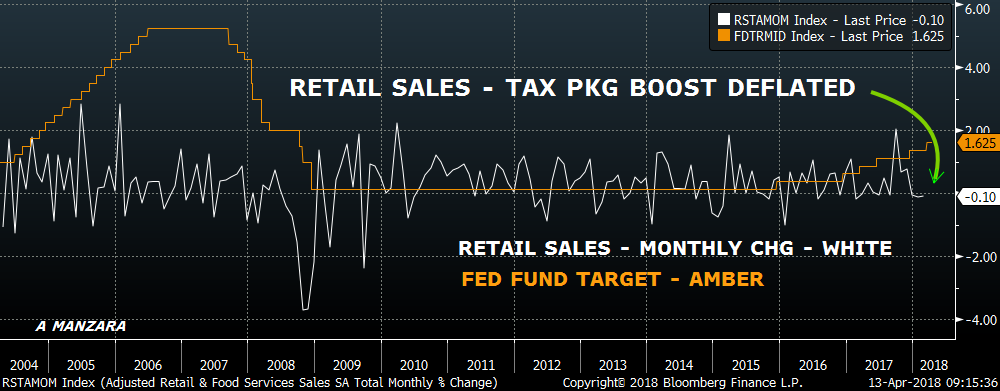
One last chart regarding economic data. Retail Sales are out on Monday, and recent numbers have indicated deceleration, in part due to a pay back after fall hurricane-induced spending. Here’s a chart of retail sales, which doesn’t look particularly robust.
The upcoming elections may also have bearing on the markets, as midterms portend damage to the Trump financial revolution. Here are links which indicate odds of Democrat/Republican control of the House and Senate. Currently, approx. 70% chance of Dems controlling House and 63% chance of Reps retaining Senate.
https://www.predictit.org/Market/2704/Which-party-will-control-the-House-after-2018-midterms
https://www.predictit.org/Market/2704/Which-party-will-control-the-House-after-2018-midterms
Week ahead: Chock full of Fed speakers. Bostic on Monday, (1:15 with Q&A). On Tuesday Williams at 9:15 then Quarles at 10:00 (semi-annual testimony at House Financial Services Committee), and then Harker at 11:00. Dudley on Wednesday at 3:15 (with Q&A). Mester on Thursday evening at 6:45, and then Evans at 9:40 on Friday, followed by John Williams to wrap up the week at 11;15 (Fireside chat at Berkeley).
Economic events include Retail Sales on Monday, Housing Starts and Industrial Production Tuesday, Beige Book Wednesday, Philly Fed and Leaders on Thursday.
OTHER MARKET THOUGHTS/ TRADES
Typically the curve steepens when the Fed is done hiking and the market anticipates eases. The Fed narrative may begin to change, but it probably won’t be this week. More hikes means flatter. The synthetic steepener I highlighted this week. even though it wasn’t that big, was the 0EZ/2EZ 9725 call calendar, where paper bought the Short Dec on EDZ9 and sold the Green Dec on EDZ0 at 0.25 credit and then flat premium. At the time, the futures spread EDZ9/EDZ0 was 6.5. That spread settled at a new low of 4.5. The calls settled 13.5 ref 9711 in EDZ9 and 14.5 in 2EZ 9725c vs 9706.5; a small loss from entry. Another trade of the same ilk was done about a month ago: +45k 0EZ 9750c vs -30k 3EZ 9725c at a credit of 4.0 to 4.5 in middle of March. Prices were 9.75 and 16.75 so 29.25 (3x) vs 33.5 (2x). On Friday these settles were 7.75 (x3 is 23.25) and 14.5 (29.0), ref 9711 and 9705.5. Not particularly painful, but not exactly how it was SUPPOSED to unfold. The point here is that a stubborn Fed causes the back end to rally if, for example, asset prices fall. I have been recommending call spreads on blues and greens. Anything that causes an unwind of trades like those mentioned above will support the back end.
| 4/6/2018 | 4/13/2018 | chg | |
| UST 2Y | 226.6 | 236.1 | 9.5 |
| UST 5Y | 258.2 | 266.7 | 8.5 |
| UST 10Y | 277.5 | 282.1 | 4.6 |
| UST 30Y | 302.0 | 302.5 | 0.5 |
| GERM 2Y | -58.8 | -58.2 | 0.6 |
| GERM 10Y | 49.7 | 51.1 | 1.4 |
| JPN 30Y | 73.8 | 69.3 | -4.5 |
| EURO$ Z8/Z9 | 29.5 | 30.0 | 0.5 |
| EURO$ Z9/Z0 | 6.0 | 4.5 | -1.5 |
| EUR | 122.83 | 123.31 | 0.48 |
| CRUDE (1st cont) | 62.06 | 67.39 | 5.33 |
| SPX | 2604.47 | 2656.30 | 51.83 |
| VIX | 21.49 | 17.41 | -4.08 |
_______________________________________________________________________
April 13. Weekly wrap
–Another day, another marginal new low in 5/30 yield spread in spite of the 30 year auction. Spread closed 37.3, down 1 bp; other curve measures holding just above the lows. Stocks found their footing as US policy seems to consist of threats which are then watered down, and we’re on the back end of that mini-cycle at this point. There are also high hopes for a strong earnings season. On a more troublesome note, yields continue to rise, with unabated pressure on libor. EDM8 settled right at the low of 9863, down 3 on the day. When discounting the stream of future earnings do we use libor or fed effective? In any case, Fed fund contracts are also being sold. FFN8 settled 9810 or 1.90% with current Fed Eff 1.69, so 21 bps of June’s hike are priced in. The ten year yield was up 4.5 bps to finish at 283.2. Bloomberg notes that foreign buyers appear to be pulling back from auction demand, citing smaller percentages of indirect bidders at this week’s sales.
–A couple of trades to note. First, about 60k EDM9 9725 puts sold covered, equating to straddle prices of 40.0 and 40.5. EDM9 9725^ settled 40.5 ref 9724.5. Put sales were an exit, with open interest dropping 48k. Second, there was a buyer of 0EZ 9725c vs 2EZ 9725c, only about 8k, buying front at flat and -0.25. Both calls settled 14.75. EDZ9/EDZ0 spread settled 6.5, 9713 and 9706.5. Sure, the spread in front (U9/U0) is 9.5, but the curve is in a flattening trend, there are small signs of inversion, and the Fed doesn’t appear inclined to stop hiking. At this point, I am a BUYER of green (2EZ) calls. There comes a straw in the tightening process when the camel can’t stand anymore, and the back end leads the rally. Sometimes it’s obvious, like November 1994, with a late cycle hike of 75 bps in one go. Sometimes it’s nearly imperceptible. Once again, EDZ0/EDH1 settled -0.5. Contracts from March20 to March 22 are all between 2.875 and 2.99%.
–A few Fed speakers today including Rosengren at 7:30, Bullard at 9:00 and Kaplan on a panel at 1:00. Here’s a quote from a Rosengren speech on March 9, just over one month ago: “To keep the economy on a sustainable path, I expect that it will be appropriate to remove monetary policy accommodation at a regular but gradual pace,” Rosengren said, “and perhaps a bit faster than the three, one-quarter point increases envisioned for this year” in the December projection of appropriate policy by Fed officials. Not likely to be any change there.
April 12. Bonds shrugged
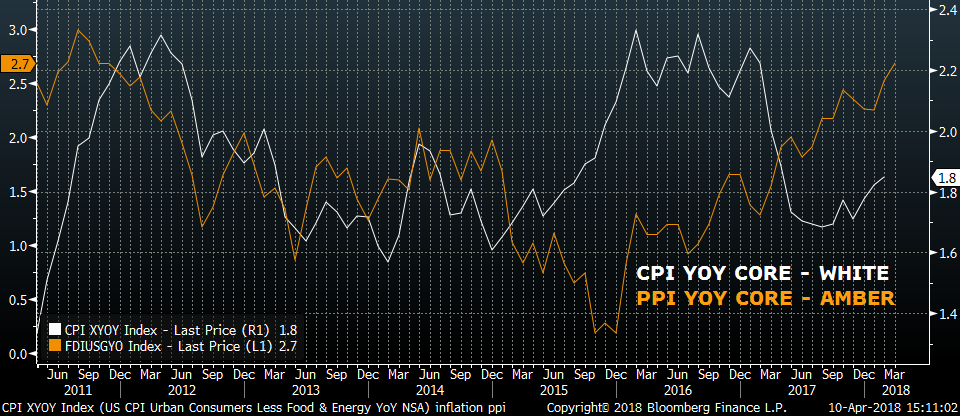
–Although there were several high profile events Wednesday, rates were little changed in the US. CPI was released in the morning at -0.1 and Core of 0.2, but yoy measures were above the Fed’s threshold: 2.4% and Core of 2.1%. Later in the day, the NY Fed released its Underlying Inflation Gauge (UIG) which also continues to push higher. The ‘full data set’ increased from 3.07% in Feb to 3.44% in March. The ‘prices only’ measure increased slightly from 2.21 to 2.23%. Prices of actual commodities were also in play yesterday, with crude oil breaking out to a new high. Clearly this move is related to mideast tensions, but I would note that the one year spread CLK8/CLK9 closed just below a new high with the near trading at a premium of $5.70 ($66.82 vs 61.12). This premium is more than 9% over the year. News reports that the Saudis had intercepted missiles over Riyadh was a contributing factor.
–Ten year note auction went off at 2.795, with the smallest percentage awarded to indirects since 2016. (Indirects are often thought as a proxy for foreign central banks). The eurodollar curve was little changed, though EDM8 closed -2.0 at 9766.0, the weakest contract on the board, getting hit after the FOMC minutes were released (EDM8 prints 9765 this morning). While some Fed officials viewed a trade war as a downside risk, for the first time zero participants thought the downside risks to inflation outweighed upside risks. In fact some participants thought a steeper tightening trajectory made sense.
–Implied vol continues to dwindle, with a notable sale of 12k USU 143p at 1’21. USU 145^ settled 4’54 or 6.9 vol. 5/30 notched a slight new low at 38.4 in spite of today’s 30y auction. The Fed, by many measures, is finally hitting inflation targets, yet there’s absolutely no inflation/term premium in the curve which is further emphasized by compressed implied vol. I would note that the Fed’s QT program this quarter features $30b/month of which $12b is MBS. While the Fed doesn’t hedge MBS, the private market does, yet this additional ‘supply’ isn’t translating into a vol bid.
April 11. The Good, the Bad and the (inflation) Ugly
April 10. Xi supports US stocks. Bonds…not so much
–China’s Xi warned against a ‘cold war mentality’ as US/Russia relations slip into a deep freeze with US sanctions causing a plunge in the ruble (amid pending military decisions in Syria). Xi also indicated he would take steps to open China’s markets, for example, to autos. The result was a yoyo ‘risk-on’ rally, after yesterday’s late afternoon sell-off prompted by the FBI raid on the homes and offices of Trump’s personal attorneys.
–Today’s news includes PPI, expected +0.1 with Core +0.2, and NFIB small business optimism, which remains robust, expected 107. Treasury auctions 3 year notes today, followed by 10’s and 30’s Wed and Thursday. The market will gauge foreign demand as the avalanche of supply continues. China opening markets, but closing the wallet that funds US deficits? Not helping matters is news that the CBO raised US deficit estimates to over $1 trillion by 2020, essentially matching forecasts that Primary Dealers had already made (as mentioned in weekend piece). In the future, Primary Dealers, cover your work so the CBO can’t copy off you. I guess that leaves OMB dangling out there with a $450 billion deficit estimate in 2020, pulling down the curve. Treasuries have been less prone to flight-to-quality bids as the weight of future supply tempers impulse buys. And if signs of slower economy DO create demand for yield, that money will be siphoned away from stocks this time, without central bank QE floating all boats.
–Implied vol in rates pressed lower yesterday, with treasury vol across the curve at new lows. I marked TYM at just 3.5, 121.0^ 1’14s.
April 8. Employment and Inflation? Or Asset Prices?
Fed Chair Powell’s speech on Friday was a boilerplate discussion of the labor market, productivity, and inflation. Solid presentation, with a requisite number of charts. The basic message is that risks are balanced, while wages and inflation should continue to firm up. With respect to growth he noted, “The median of FOMC participants’ projections of this longer-run trend growth rate is 1.8 percent. The latest estimate from the Blue-Chip consensus of private forecasters is about 2 percent.” On the inflation front, he actually referred to the huge drop in mobile phone usage prices that had distorted CPI a year or so ago and noted that year-over-year comparisons would strengthen further as those effects drop off the calendar. (A google search for mobile phone usage prices and CPI gives several results from June 2017). The conclusion is, “…further gradual increases in the federal funds rate will best promote goals.”
What was omitted from the speech? There was nothing about ‘assets’ or ‘asset prices’, and nothing about libor (which both figure prominently in the economic outlook). Brainard’s speech earlier in the week deemed asset prices as “elevated’. Bostic said the Fed doesn’t currently view market volatility as a problem. Bullard doubled down on his prediction of last December, noting that curve inversion later this year remains a possibility. He added, “I should be TRADING this stuff!” No, he didn’t really say that, but perhaps he was thinking it, like many prognosticators that latch onto their one-in-ten accurate calls as overwhelming evidence of superior models.
The point is, the current model is complicated, financially, politically, and internationally. I have been thinking about weakness the dollar as it relates to equity prices, and to the price of crude oil and other commodities. Many have wondered why the dollar hasn’t firmed given wide rate differentials and a Fed that appears intent on a course of tightening. Last week I highlighted recent correlation between the flattening curve and the lockstep decline in DXY. This week I have been thinking about net treasury issuance as a proxy for an increase in supply of USD. Though that particular theory may have zero validity, I found it interesting to glean some information from TBAC (the Treasury Borrowing Advisory Committee). For example, in Q1, the Treasury raised $440B in new net cash (this at a time when the Fed’s QT is at a supposed rate of $20b per month). In Q2 net issuance is estimated at another $192 billion (with QT at $30b/month). These are big numbers. The Q1 2018 Treasury presentation is also interesting in terms of the chasm between Primary Dealer estimates of the Federal Deficit vs the CBO and OMB. For 2018, 2019 and 2020, Primary Dealers estimate $750b, $965 and $1025. CBO estimates run at 2/3 to 3/4 of those amounts, and OMB fancifully runs at about half, projecting a deficit of only $488b in 2020.
In any event, we have a situation where the Fed is content to continue tightening, the treasury is on a borrowing spree, and asset prices hang in the balance. Stocks are not taking kindly to Trump’s tariffs and his attacks on big tech. He admitted we may ‘take a hit’. The combination of former Fed encouragement for companies to issue debt for stock buybacks along with the current potential for ‘crowding out’ due to treasury borrowing is of looming concern. These factors have negative connotations for both the curve and the dollar. Indeed, the curve remains pegged to the lowest levels since the crisis years of 2007/2008. JPM notes inversion in the forward OIS curve. I have previously mentioned the inversion in EDZ0/EDH1 at -0.5, and on Friday, as the April serial Eurodollar is set to expire in one week, the April/June Eurodollar spread closed at -1.0 (J8 9767.0 and M8 9768.0). Flight-to-quality impulses are muffled by both the Fed’s stance and upcoming treasury supply.
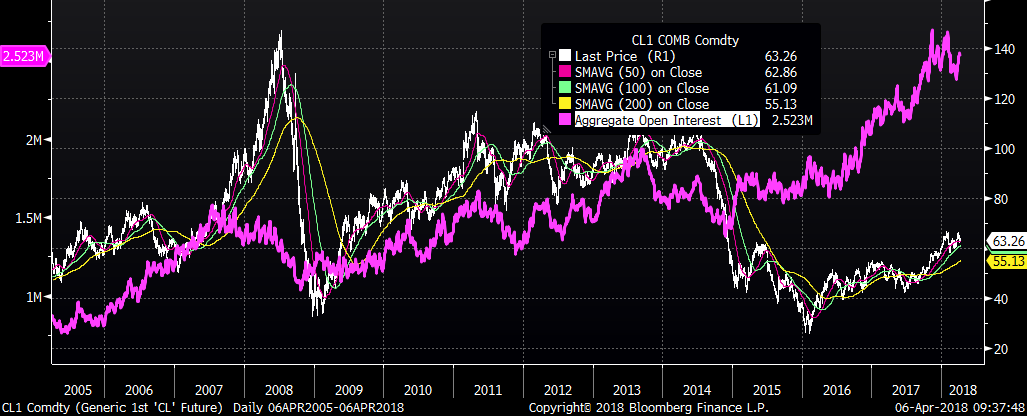
Let’s suppose for a moment that a somewhat slower pace of treasury borrowing in Q2, along with higher inflation readings that support Fed hikes, conspire to boost the value of the dollar. What happens to commodity prices? Arguably the most important commodity in the world is oil, notwithstanding mobile phones. Below are a few charts relating to WTI.
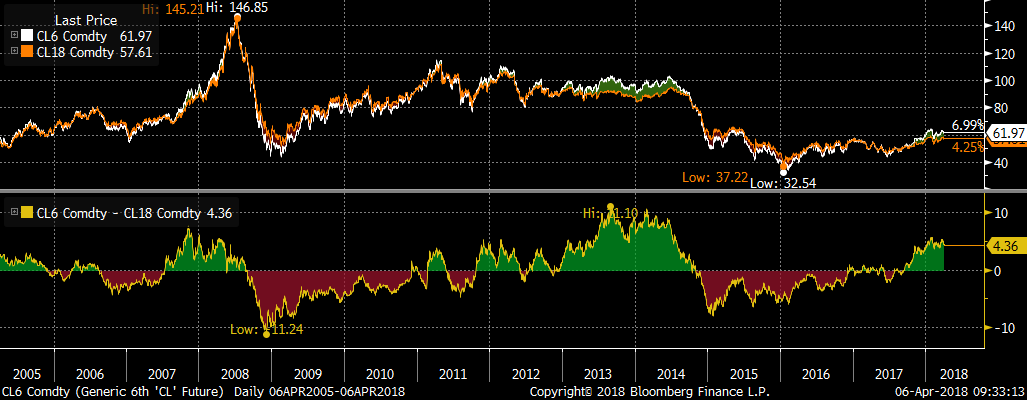
The top chart is the rolling price of the front CL contract in white, along with aggregate open interest showing 2.5 million contracts in violet. The second chart shows the spread between the forward 6th to 18th contract. Note that nearer contracts trade at a premium (denoted by green areas), just as they did prior to large plunges in 2008 and 2014.
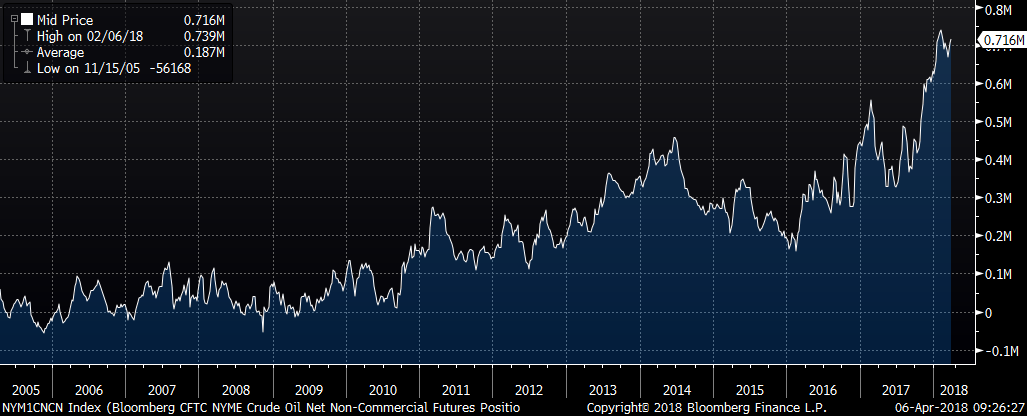
 The final chart, shows the Commitment of Traders (COT) record net speculative long position of over 700,000 contracts. Again, this chart shows an interim high in 2014, just before oil took a tumble. Friend and energy expert JJ notes that commercial shorts are embedded in credit deals, the implication being that IF prices fall, these shorts will not provide a bid as they’re locked into positions. I do not have any special insight into the energy markets; I assume that Saudi Arabia and Russia both have strong incentives to keep oil prices high, and that the new petro-yuan trading in China is another factor that perhaps leads to a softening USD. My only point here is that IF the dollar were to firm, and IF that were to lead to a lower USD price of oil, an unwind of the record long spec positions could magnify losses at a time when huge open interest provides tinder for the conflagration.
The broader point is that a rally in the dollar could easily translate into lower asset prices, upon which the US economy has become dependent.
One last thought concerns the idea that China might sell US treasury holdings as a response to tariffs and other trade restrictions. The NY Fed chief-to-be, John Williams, trotted out the standard line, that China would do itself great harm if it chose that course (from Reuters). I think, to paraphrase Mark Zuckerberg, that response is “glib”. According to the FSB, about 50% of “the world’s riskier non-bank loans are held in China. Linked to the supply of credit, these loans could pose ‘systemic risk’ “. China has been taking hard steps to decrease financial excesses, including the takeover of Anbang. This week HNA disclosed it was trying to sell its stake in Hilton in an effort to escape crushing debt. While Trump warned the US might take a hit with regard to trade measures, China appears quite willing to take short term pain in pursuit of long term goals. This week’s US Treasury auctions of 3’s, 10’s and 30’s beginning on Tuesday may be more important than usual.
Week ahead: On Tuesday PPI is expected +0.1 Core +0.2. NFIB is also out…watch this one, it’s been correlated with Russell so a large decline would be a worrisome signal. On Wednesday CPI expected 0.0, yoy 2.4, and Core 2.0 from 1.8 (!!!). FOMC minutes on Wednesday. FB’s CEO Zuckerberg testifies to Congress Wednesday, which can only be disastrous. Auctions: 3, 10, 30 start Tuesday.