
April 6. We’ve lost the script
–Employment day. Nonfarm payrolls expected 190k, with yoy Average Hourly Earnings 2.7%. Powell then speaks at 1:30 EST in Chicago. I saw no indications of an early release of the text; that should be released at 1:30. I’m sure Powell will re-emphasize that the stock market is NOT the economy which would be negative for both stocks and bonds.
–Yesterday’s trade featured higher yields and lower vols as stocks continued to climb. Ten year +3.8 bps to 282.6. Green and blue packs both fell 4 bps. April euro$ midcurves expire one week from today. Green and blue atm April straddles settled at 9.5 and 10.0, both the 9712.5 line. TYM atm vol just 3.6.
–Once again I will note that April/June dollar spread settled at just 0.75 while EDM8/EDU8 settled 8.5. One month overlap of April dollars with the June FOMC so that contract should reflect odds of a hike for that one month, while June gets the whole enchilada. May/July FF spread settled 18 bps, so the FF market prices odds of a June hike around 75%. So, if there were no libor distortions then April/June should price about 2/3rds of the odds of a June hike, which would put the spread at about 11 or 12. Makes EDM8 look somewhat expensive, or, makes EDM8/EDU8 appear high at 8.5. Obviously the distortions are hard to handicap, which should be of concern to the Fed.
–Speaking of volatile distortions, the President, as is his style, doubled down on the Chinese tariff proposal which others in the admin have tried to soften. As a result, stocks took a tumble early this morning, erasing yesterday’s gains. For a long time, markets ignored the political arena, but this year that changed, and has been accentuated by the apparent loss of influence of the steady Gen’l Kelly. Yesterday, Trump ignored prepared remarks related to taxes. He has generated confusion about US military plans in Syria. He has lashed out at big tech while previously having basked in the paper gains that the sector provided. Trump is going to need another scapegoat. You’ll notice that Mnuchin seems to be keeping his head down recently. Current targets are tech and China, but soon enough that will shift to the Fed. In an era where national leaders are being tossed in jail in comparable frequency to former Illinois Governors, (S Korea former president sentenced to jail, former Brazil president Lula being arrested) the political environment in the US could get, well… stormy.
April 5. Stocks respond to tweets, the Fed doesn’t
–Monster rally in stocks completely erased Monday’s losses. While SPX had broken the 200 DMA, it closed well above yesterday. Nasdaq and Russell have thus far held 200 day averages. Rates edged higher, with tens +1/2 bp to 278.8. EDM8/EDM9 spread, which remains the peak one-yr calendar, settled 38, but was 39/39.5 late. There continues to be buying in front call spreads vs midcurve calls. Yesterday +30k EDN8 9787/9812cs vs -30k 0EN 9787c flat. (Settled flat, 1.5/0.25 vs 1.25). July options have Sept futures as underlying. EDU8/EDU9 spread is 35 bps. With EDU8 9760 (calls are 17.5 bps out of the money), the favored scenario would be a compression of libor/ois along with clear signals by the Fed that the tightening campaign is drawing to a close. If Bullard were the Fed chief then these trades would be great! Yesterday, Bullard said rates are already close to neutral and that he hasn’t seen much in the way of wage inflation. However, he also said curve inversion later this year remains a possibility.
–Economic data this week suggests tightening still on course, and that is likely the message that Powell will reinforce on Friday. Again, Brainard in Wednesday’s speech said that asset prices are still elevated. The Fed’s new motto is “The stock market is not the economy.”
April 4. Markets to test Powell
–As mentioned yesterday, the 50% retracement in SPX from the post-election low to the high of 2871 in January is 2431. That target, if reached, represents a 15% decline from the high. The question is, how much pain does the market have to inflict before it’s considered a true test of Powell? The Senate confirmed Greenspan as Fed chair on August 11, 1987. Two months later we had the crash. Powell’s speech on Friday takes on increased significance in terms of its effect on risk assets. It’s what we might call a ‘pop-quiz’.
–The press is generally attributing this morning’s weakness to China’s tariff response. But in a bearish market, negative news looms just a little bit larger. So stories referencing a decline in Manhattan real estate as ‘buyers walk away’ or mall vacancies at 6 year highs, aren’t shrugged off as easily. Of interest yesterday was Brainard’s speech on Financial Stability. Why now? Speech was quite interesting and comprehensive, except I thought it was light on risks related to non-US weaknesses in the financial system. The first part served mainly as a warning and acknowledgment that many asset prices are elevated. “Valuations in a broad set of markets appear elevated relative to historical norms, even after taking into account recent movements.” However, protection to the system comes mostly in the form of a capital buffer, which is deemed robust in the US. But there’s also concern about using treasury yields as a benchmark: “In the assessment of elevated asset valuations, the relatively low level of Treasury yields is a mitigating factor; many asset valuation metrics, such as price-to-earnings ratios, corporate bond yields, and property capitalization rates, appear notably less stretched when judged relative to low Treasury yields. That said, Treasury yields reflect historically low term premiums–the compensation investors demand to hold assets over a longer horizon. This poses the risk that term premiums could rise sharply–for instance, if investor perceptions of inflation risks increased.” One other Fed note is that SF Fed’s Williams was named to take over the NY Fed. The NY Fed always is on the FOMC, and obviously is more closely intertwined with markets. Bloomberg notes that Williams is long on academics, short on markets, another little exposed chink in the armor that may be tested.
–Green euro$ pack closed -5 yesterday as stocks rebounded. But this morning that deficit has not been retraced even as stocks see renewed selling. Interesting trade yesterday was a buy of 50k EDM8 9787/9812c 1×2 vs sale of 0EM 9787c for 0.25. In turbulent (equity) markets, the front would be expected to outperform. But tighter funding markets could also result. EDM8/EDM9 closed 37.5, so there’s plenty of cushion. For now.
–Today’s news includes ADP, non-Mfg ISM and Factory Orders.
Link to Brainard speech:
https://www.federalreserve.gov/newsevents/speech/brainard20180403a.htm
April 2. Easter Monday (thin conditions)
–Stocks seeing some pressure this morning as China retaliates with tariffs on US products (and Trump shifts attention to Mexico).
–On Friday all measures of the curve made new lows. The peak one-year euro$ calendar spread is EDM8/EDM9 which settled at 3/8% (37.5 bps). The next year out, EDM9/EDM0 settled at 1/8% or just 12.5 bps. A comparison with Fed Fund contracts clarifies the effect of the libor widening, as July’18 to July’19 FF spread closed 48.5, or 11 higher than EDM8/9. In any case, all spreads made new lows, with red/gold pack spread at just 13.5 bps. Same with the treasury curve, as 2/10 closed 47.3, -1.4 on the session. For the first time, a euro$ calendar spread settled negative, with EDZ0/EDH1 at -0.5.
–Typically, a rout in the stock market would provide some support to the curve as the Fed would be expected to take a step back from the idea of tighter policy. However, Powell has tried to separate stock valuations from the broader economy, and may expound on that theme during Friday’s speech to the Economics Club of Chicago. Employment data is also released Friday. Today brings ISM Mfg, expected 60.0 from 60.8.
–Albert Edwards of Soc Gen considers the idea that Trump may threaten the Fed’s independence if the economy turns down. According tp the Richmond Fed website: “…the Federal Reserve derives its authority from the Congress of the United States. It is considered an independent central bank because its monetary policy decisions do not have to be approved by the President or anyone else in the executive or legislative branches of government. …the Federal Reserve is subject to oversight by the Congress, which often reviews the Federal Reserve’s activities and can alter its responsibilities by statute.” In a 2010 speech Bernanke felt compelled to defend the Fed’s independence: “Chief among these aspects has been the ability of central banks to make monetary policy decisions based on what is good for the economy in the longer run, independent of short-term political considerations. Central bankers must be fully accountable to the public for their decisions, but both theory and experience strongly support the proposition that insulating monetary policy from short-term political pressures helps foster desirable macroeconomic outcomes and financial stability.” Expect some echoes of this speech over the coming months from Powell.
April 1. Flatter curve weighs on USD
Taking a look at some longer time frame themes this week, in part relating to inflation. This note will appear longer than usual due to the addition of several charts.
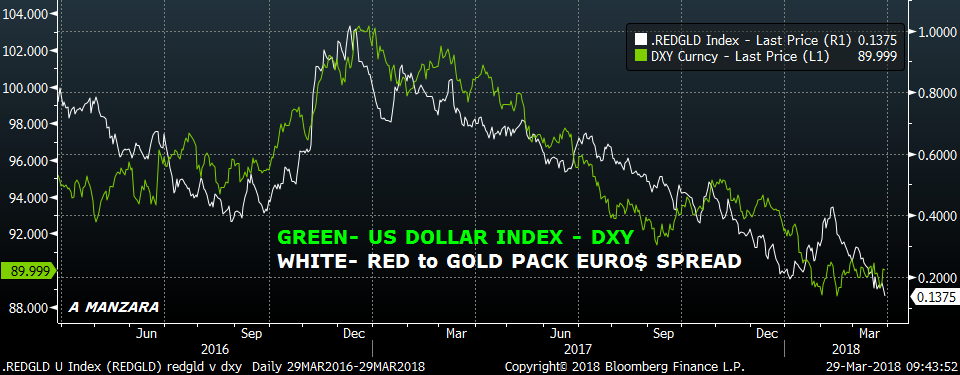
At least part of the discussion concerns the value of the dollar, which in turn is at least partially related to interest rates. I lead off with a couple series plotted over different time frames: the dollar index vs the Eurodollar red to gold pack spread. The red/gold pack spread is the 2nd year to 5th year forward on the euro$ curve, which correlates to 2/10 or 5/30 (a chart below will show all of these together). There have been many head-scratching articles noting that the dollar has weakened in spite of widening rate differentials, especially between European and US rates. In fact, this week the bund to ten year UST spread reached 232 bps before closing at 225, the widest it has been since late 2016. We all know that correlation is not causation, but it certainly appears as if movement in the curve has a strong relation to DXY on the chart below. There are a couple of things to note. First, the election in 2016 caused a surge in the curve and in DXY, with Trump’s promise to unfurl his version of protectionist deregulated capitalism. (I know it doesn’t make sense, but what does?) The next largest pop in the curve was at the beginning of this year, as the promise was fulfilled with the tax package. Fairly muted response to the actual policy implementation. Ultimately, DXY never really bought into the tax package, perhaps due to tariffs, and this week the curve made new lows.
Now let’s consider the same chart over a longer time frame. Over five years, the curve and DXY have little correlation. After the curve (and ten year yields) posted their highs following the mid-2013 taper-tantrum, a flattening trend unfolded. But by mid 2014 the dollar began a surge higher as Abe’s yen depreciation was in full swing and the ECB’s QE program was anticipated. US growth was strong in 2014, with GDP hitting 5.2% in Q3/14.
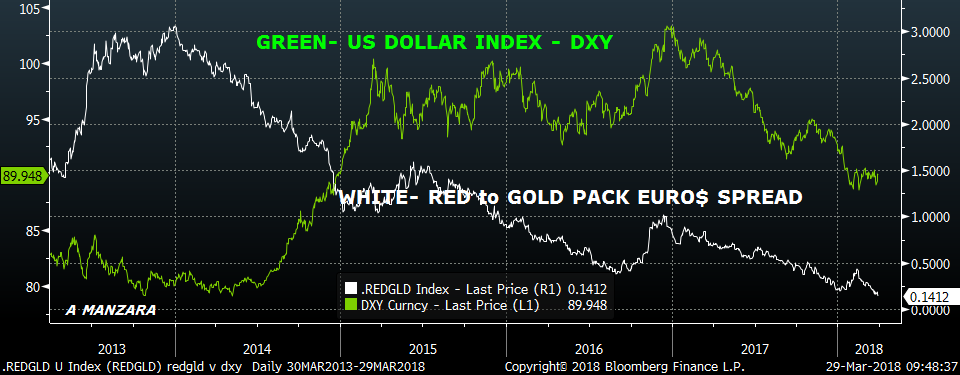
Eventually, weakness in the currencies of US trading partners elicited a response by China, with devaluation in August 2015, sparking renewed fears of deflation due to the price cut on Chinese manufactured goods.
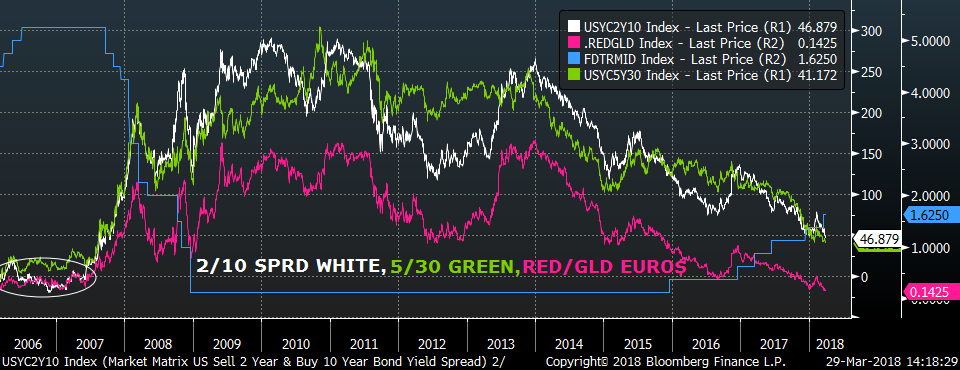
So where are we now? This week, the red/gold pack spread, as shown below, closed at a new low of 13.5, within a few bps of the low set in 2006, near the end of the last hiking cycle. While the treasury curve is well above previous lows, both 2/10 and 5/30 also made new lows this week at 47.3 and 40.7. This is late stage economic cycle stuff. We know how it ended in 2007/2008.
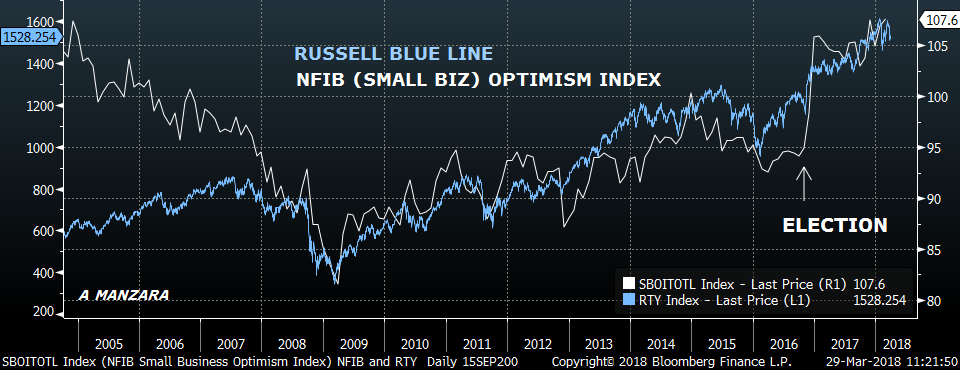
However, one might say that technical factors are at play, which distort economic signals, and therefore it’s incorrect to conclude that growth will slow. In fact, that’s what Powell DOES say, and there’s some evidence that supports that claim. For example, consider the next chart, which plots NFIB small business optimism vs the Russell 2000 small cap index. It’s clear that small business optimism was declining from 2005 on, in anticipation of larger problems ahead. The curve was flattening then, too. However, in the current period, optimism is clinging to fairly high levels despite a bit of shakiness on the equity front.
The other factor to note is that inflation appears to have gotten a foothold, with for example, the NY Fed’s UIFG (Underlying Inflation Gauge) posting a new high above 3%, and the Fed’s preferred measure of PCE prices printing respectable rates of +1.8% with Core +1.6.
Additionally, CNY is essentially back to where it was before the devaluation (Aug 2015), as the next chart shows. (Some analysts look at the spread between off-shore and domestic yuan to determine stress, as was evident in the latter part of 2015. I’ve included both on the chart below). While the yuan has strengthened relative to the dollar, it has been steady vs the euro for the past year. It’s the dollar that’s weak, and a weaker dollar eventually feeds into a bump in inflation.
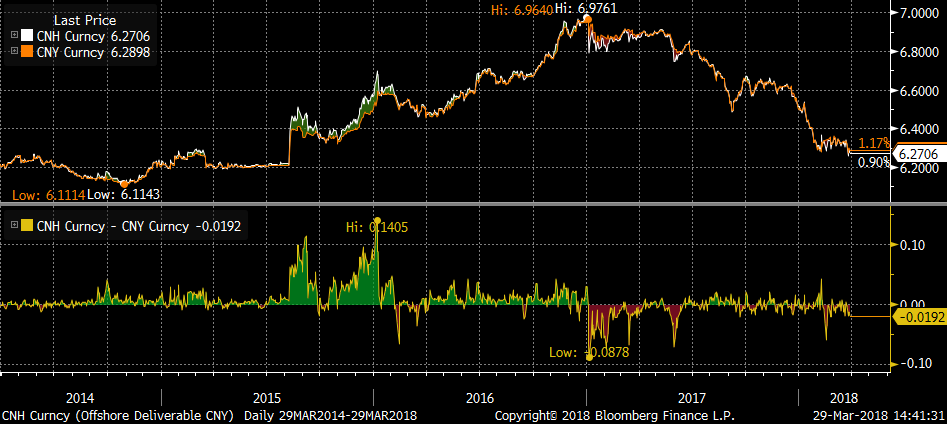
In fact, if the powers that be decided that the best policy response to relieve the burden of crushing debts and pension obligations were to weaken the dollar and try to inflate away debts, they’re doing a pretty good job. How to ensure a weaker currency? 1) Lift rates gradually, being careful not to actually tighten conditions too much 2) increase the trajectory of treasury issuance 3) impose tariffs 4) attack the technology companies that have been driving wages and prices lower. The problem of course, is that the ‘wealth effect’ can shift into reverse, creating a headwind to growth, and possibly resulting in stagflation.
News this week includes
Monday: Mfg ISM expected 60 vs 60.8.
Tuesday: 4:30 NY Time, Lael Brainard speech on Financial Stability
Wednesday: Non-Mfg ISM expected 59 from 59.5, along with ADP.
Friday: Employment Report, with NFP 189k.
**Powell also speaks on Friday at the Economic Club of Chicago on the Economic Outlook
_______________________________________________________
| 3/23/2018 | 3/29/2018 | chg | |
| UST 2Y | 228.7 | 227.0 | -1.7 |
| UST 5Y | 261.5 | 256.4 | -5.1 |
| UST 10Y | 282.3 | 274.3 | -8.0 |
| UST 30Y | 306.9 | 297.1 | -9.8 |
| GERM 2Y | -61.1 | -60.2 | 0.9 |
| GERM 10Y | 52.7 | 49.7 | -3.0 |
| JPN 30Y | 73.6 | 73.8 | 0.2 |
| EURO$ Z8/Z9 | 32.5 | 29.0 | -3.5 |
| EURO$ Z9/Z0 | 7.5 | 5.0 | -2.5 |
| EUR | 123.56 | 123.23 | -0.33 |
| CRUDE (1st cont) | 65.88 | 64.94 | -0.94 |
| SPX | 2588.26 | 2640.87 | 52.61 |
| VIX | 24.87 | 19.97 | -4.90 |
March 29, 2018. Paring back ED calendar longs
–End of month and quarter. Net changes yesterday weren’t particularly large, with the ten year yield -1.9 bp to 277.3. However, many euro$ calendar spreads eased to new recent lows as the curve flattened. Partially due to the new 2y, 2/10 closed 48.7, a new low and down 3 on the day. 5/30 closed 42.3. While the red/gold euro$ pack spread is only about 7 bps from the low made near the end of the 2004/2006 hiking campaign, treasury spreads are still well above those levels. For example, red/gold settled 16.75 vs a low 10.25 in Feb 2006. But both 2/10 and 5/30 went negative at that time, with the former -19 bps and latter -10. In any case, near euro$ one-year calendars made new lows, with the peak spread, EDM8/M9 at 38, -0.5 on the day. EDZ8/EDZ9 fell 2 to 30, and EDZ9/EDZ0 also fell 2 to close at 6.0. Open interest changes were small on Z8 and Z9, but EDZ0 plunged 70k, so it appears as if some of the long spreads are throwing in the towel. Red to green pack spread (2nd to 3rd year) closed at a new recent low of just 8.5 bps (which of course, fits with the price action). The other notable open interest decline was in EDM8, which fell 35k.
–Today brings the Fed’s favored inflation gauge, PCE prices. Headline yoy is expected 1.7% (unch’d vs last) and Core expected 1.5 to 1.6 vs 1.5. If the number is low, then stocks will likely rally as a less aggressive Fed might be the perceived outcome. If higher than expected, then look for new lows in the curve. Either way, it seems like odds favor a further rally in greens and blues.
–Beware long weekend exits and dwindling size bid/offer in equity index products. These days are subject to air pockets.
March 27. 200 DMA
–Stocks rebounded Monday and interest rate futures traded lower. Ten year yield rose a couple of bps to 284.3 as the market digested the 2 yr auction with 5’s to follow today. Good buying in the morning (+80k) in EDM8 9762/9750/9737p fly for 2.25…friend BC pointed out that May 9762/9750ps was offered at 2.25 vs 9768.0 with nearly twice the delta, 25 vs 15. Both settled 2.25. Same premium, more bang. How many can I put you down for?
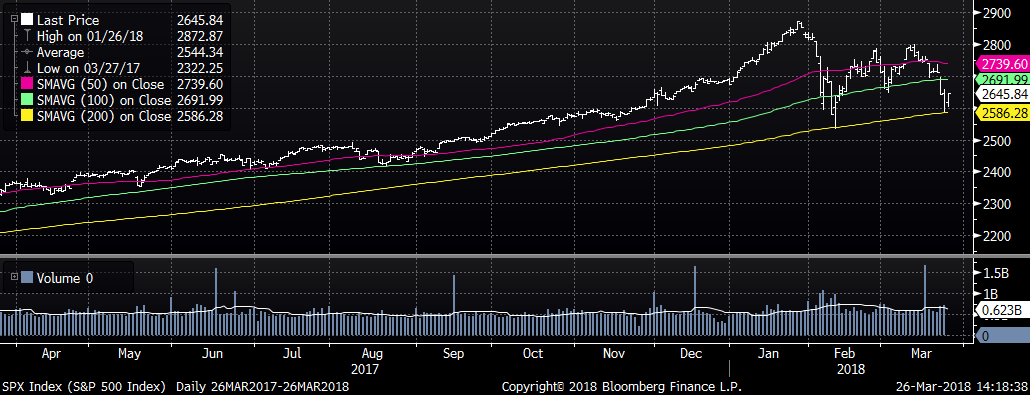
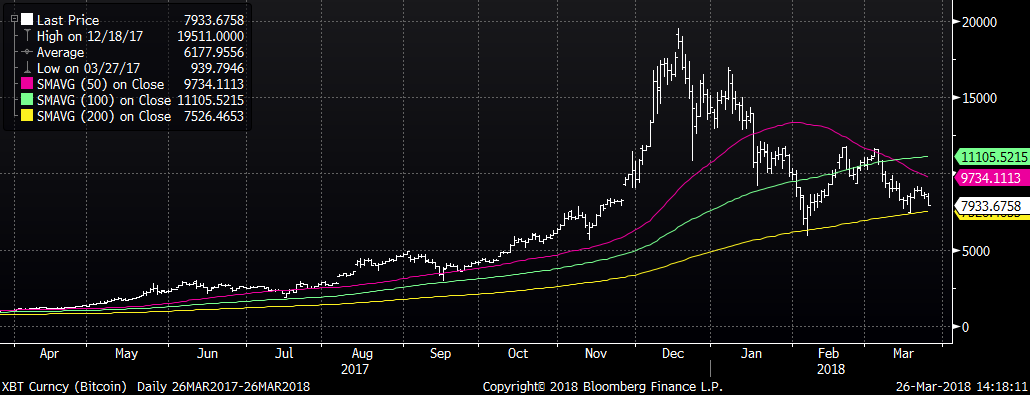
–Stocks continue a mad bounce off the 200 day moving average. Charts below show that the 200 DMA has held as support for both SPX and Bitcoin on two occasions this year. The difference is that SPX has bounced like an exuberant child on a trampoline, while bitcoin is, well, rather less enthusiastic this time around, ready to puke a mixture of birthday cake and soda. Third time’s a charm; XBT has been leading.
–Attached chart is a clear reflection of libor distortion. Going into February, EDM8/EDU8 and FFN8/FFV8 tracked each other within 0.5 to 1.0 bp. Since then they’ve gone their separate ways, with the former settling at 7.5 and the latter at 14.5.
–ED calendar spreads generally perked up on the sell off. EDZ8/EDZ9 rose 1.5 to 34.0. The longer this holds 29.5, the more likely it takes another run towards 40. Greens have been the pivotal area of the curve recently, leading the downside yesterday -2.875 (reds -2.125 and blues -2.625). Outperformance in either direction recently which suggests that, if one favors steepeners, buy greens and sell deferred. Same with flatteners.
–Conference Board Consumer Confidence today expected 131.0.
–Going into month/quarter end on a holiday week. Moves associated with rebalancing could be somewhat exaggerated.
SPX top panel, XBT lower panel
March 26. China and the US patching it up
–Friday’s session was dominated by the slide in stocks, with SPX -2.1% and Nasdaq -2.4%. Yields edged modestly lower by the futures close and then posted further gains into the end of the electronic session. However, we’re seeing a nice bounce this morning as news sources report that China and the US are working to resolve trade differences (as China opens its petro-yuan futures, threatening to dominate yet another market). Both HYG and JNK made new low closes for the year, though they are well above the low associated with the energy patch carnage in late ’15, early ’16.
–Today’s news includes the Chgo Fed National Activity Index, which was 0.12 last, with the report noting “little change to economic growth in January”. Dudley speaks on regulatory issues (is that guy ever going to actually leave?) and the treasury auctions 2 year notes. SF Fed’s Williams reportedly at the top of the list to replace Dudley.
–On the dollar curve, EDM18 calendar spreads made new lows, with EDM18/EDM19 falling 3 bps to just 39.5. EDM8/EDU8 closed at just 7 bps, even though there’s a hike possibility. This spread reflects near term libor pressure, as July to October Fed Funds settled higher at 15 bps (9812.5 and 9797.5), roughly indicating 60% odds of a hike at the September meeting. Back month dollar spreads remain extremely flat, with green/blue and blue/gold pack spreads both under 4 bps.
–Beware of reduced liquidity going into the holiday shortened week.
March 25. Say… What’s THIS doing here?
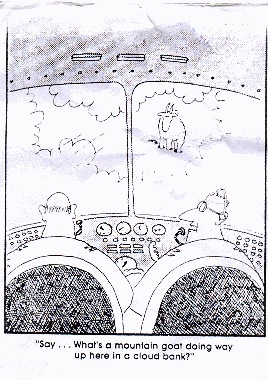
Say…why’s the dollar getting pasted? Say…why is this libor/ois spread so elevated? Say…why is the back end of the Eurodollar curve so flat? Why have stocks fallen out of favor?
There are a lot of market prices that don’t quite seem to make sense. When a price appears to be out of whack, but it’s been there for a while, there’s usually a pretty good reason for it. For example, last week I said, “One would think this [yield] widening should support the USD, and, the prospect of increased pressure on the short end could provide a further push. However, think of the converse for a second. What if something happens that causes the US front end to rally? Then USD may be subject to another hard leg down.” While the dollar didn’t go down hard, it certainly isn’t perking up, and it’s starting to appear as though weakness in equities could limit the downside in the front end. Perhaps the real risk in USD is much, much lower.
I saw a note from a guy named Rick Bensignor titled SIF’s, which stands for Supposedly Irrelevant Factors. This missive was presciently calling for a stock sell off, but what struck me was the idea of SIF, a term I hadn’t been aware of. In the footnote, it says “SIF is a term…in the behavioral and economics world that is associated with the introduction of human psychology and emotions into financially related decisions.” Though I wasn’t familiar with the term, we’ve seen the concept many times. For example, Malcolm Gladwell’s ‘The Tipping Point’, or John Mauldin’s highlight of simulated sand piles which create hidden ‘fingers of instability’. Below is a link and excerpt. One grain of sand is ‘supposedly irrelevant”.
http://www.mauldineconomics.com/frontlinethoughts/fingers-of-instability-mwo040706
Imagine peering down on the [sand] pile from above, and coloring it in according to its steepness. Where it is relatively flat and stable, color it green; where steep and, in avalanche terms, ‘ready to go,’ color it red. What do you see? They found that at the outset the pile looked mostly green, but that, as the pile grew, the green became infiltrated with ever more red. With more grains, the scattering of red danger spots grew until a dense skeleton of instability ran through the pile. Here then was a clue to its peculiar behavior: a grain falling on a red spot can, by domino-like action, cause sliding at other nearby red spots. If the red network was sparse, and all trouble spots were well isolated one from the other, then a single grain could have only limited repercussions. But when the red spots come to riddle the pile, the consequences of the next grain become fiendishly unpredictable.
My thesis here is that red spots, or fingers of instability, are now riddling the economic (and political) landscape. Whether one wants to concentrate on the myriad political comedies, or the financial ones, it’s quite plausible that we’re seeing the onset of tightened conditions and higher risk. The libor/ois spread is an example. I believe it will remain elevated and likely push higher, despite swap lines between central banks. While the plunge in DB stock may not in and of itself presage a Bear Stearns (soon to culminate in Lehman) disaster, it’s interesting to note just how slender the capital base is for European banks. All I can recall hearing over the years is that the European banking system plays a much bigger role in the EU’s financial world, and that one of the problems in the crisis was that EU banks were over-levered. Well, even after hard sell offs this week, the combined market cap of JPM, BAC, WFC and C is over $1 T. DB has a market cap of about $25B. Throw in Lloyd’s and Barclay’s, BNP, SocGen and Credit Ag, UBS and CS, ING and Danske, Santander, BBVA, Intesa Sanpaolo, and the combined 13 banks reach about ¾’s of the market cap of the 4 US banks mentioned.
Jeffrey Snider of Alhambra is focused on weakness of the Hong Kong dollar and possible break of the peg. Some are concerned about covenant lite agreements and the possibility that loan roll-overs won’t be easy. A GS piece earlier in the week noted that dominant trading strategies of the day encompass “…more speed and less capital” and markets are thus vulnerable to illiquidity. The Shanghai Composite gapped lower Friday; China is trying to tame the shadow banking system. HYG and JNK hi-yld etfs had new low closes for the year (though they’re well above the lows marked in 2016 with the energy wash-out).
Powell’s Fed is concerned about over-heating and is trying to separate the stock market from the real economy. Therefore, the posture of gradual tightening appears to be warranted. For example, the NY Fed’s Underlying Inflation Gauge (UIG) continues to edge higher and was released this week at 3.06%. However, financial conditions are cinching ever tighter. The back end of the euro$ curve reflects this dynamic. Reds to greens (2nd to 3rd year) closed just under 10 bps, greens to blues and blues to golds (3rd to 4th and 4th to 5th), both closed below 4 bps. The red to gold pack spread settled just over 17, within 8 bps of the low set during the 2004/2006 tightening cycle.
In terms of front spreads, “Say…why are the peak one-year euro$ spreads below 40 bps if the Fed is telling us they are going to tighten 75 bps per year?” Well of course it’s due to the libor surge. But don’t worry, it doesn’t represent a funding crunch, it’s simply “technical”. That’s what they’re saying. All I know is that mountain goats don’t just pop out of the clouds.
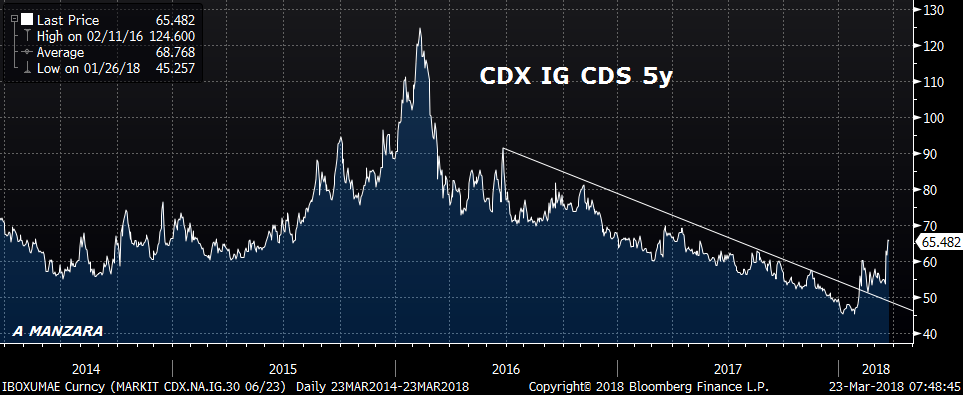
Below is a chart of Investment Grade CDS. A move of 20 bps off the lows doesn’t seem very important. But is it breaking out?
OTHER MARKET THOUGHTS
While stocks make new lows, the flight to quality reaction in fixed income appears to be increasingly muted. That’s not to say that a cataclysmic decline in equities won’t force a large drop in yields, it’s only to say that the supply of US debt in an environment of tariffs and trade wars and possible inflation acceleration is starting to appear problematic. The $1.3T spending bill that Trump signed is a case in point. From a May 5, 2016 interview, “I’m the king of debt. I love debt.”
Alas that love, so gentle in his view/ Should be so tyrannous and rough in proof.
I know….Shakespeare doesn’t quite fit with Trump. The absurd and comical truths of the Far Side (which I led off with) are much more appropriate. Sometimes the idea that looked great previously goes horribly wrong. If US debt buyers make themselves scarce, then the whole house of cards comes down.
_______________________________________________________
| 3/16/2018 | 3/23/2018 | chg | |
| UST 2Y | 229.1 | 225.8 | -3.3 |
| UST 5Y | 264.3 | 260.6 | -3.7 |
| UST 10Y | 284.6 | 282.3 | -2.3 |
| UST 30Y | 308.0 | 306.9 | -1.1 |
| GERM 2Y | -59.1 | -61.1 | -2.0 |
| GERM 10Y | 57.1 | 52.7 | -4.4 |
| JPN 30Y | 75.3 | 73.6 | -1.7 |
| EURO$ Z8/Z9 | 34.5 | 32.5 | -2.0 |
| EURO$ Z9/Z0 | 6.0 | 7.5 | 1.5 |
| EUR | 122.91 | 123.56 | 0.65 |
| CRUDE (1st cont) | 62.41 | 65.88 | 3.47 |
| SPX | 2752.01 | 2588.26 | -163.75 |
| VIX | 15.80 | 24.87 | 9.07 |
________________________________________________________________
March 23. Hammered
–When all you have is a hammer, every problem looks like a nail. Analyst explanations of the stock market sell off range from tariffs and trade wars, to domestic political issues, to tech problems etc. Maybe it’s all just part of the big karmic circle. Trump triumphantly took credit (repeatedly) for the amazing amount of wealth that he engineered, which, as we learn in this particular business, comes back to bite your ass. Whatever the case, they hammered stocks. One contributing factor is Fed policy. Not only does a higher discount rate diminish the present value of future cash flows, it also increases servicing costs on the debt that firms were encouraged to gorge on by the previous Fed. Grant’s has a new daily e-mail, and in yesterday’s missive cited this snippet from Morgan Stanley from last July: “If the companies in our universe were rated based only on their leverage, we estimate that over a quarter of the investment grade market would have a high yield rating, using Moody’s leverage buckets across sectors.” July was 100 bps ago. Creditors may not be quite as welcoming when it comes to rolling that debt over. And there’s a lot of it.
–What Trump DID capture with his embrace of equities is the idea that the economy and the stock market are as one. The Fed’s Powell is seeking to separate the two, saying that the stock market is NOT the economy. But with market cap at a near record % of GDP, I think Trump is closer to the truth. Time will tell. But the back end of the euro$ market is forecasting deceleration. Once again, reds to golds closed on the low, at only 16 bps. Yesterday was the first time that I’ve seen a euro$ calendar spread trade negative, EDZ0/EDH1 which printed -0.5. There was a new buyer of 60k EDZ9 9900c for 1.5. Open interest in EDZ9 plunged by 55k on short covering. In EDZ8 flows were 2 ways, a buyer of 100k EDZ8 9737/9725ps vs 9775c (bought the put spread flat premium) and a seller of EDZ8 9750/9725/9712p fly at 8 to 7.5. EDZ8/EDZ9 settled 34 having traded 38.5 post FOMC, and EDZ9/EDZ0 settled 7.5, having traded 10 post FOMC.
–Yields took a tumble, with tens down 7 bps to 283. EDM8 traded 9770, within a couple of bps of the 3 month libor setting, and only a couple of bps away from the 2y treasury yield which ended at 2.285%.
–Durables today. Possible comments from Bostic, Kashkari (I TOLD YOU we shouldn’t have hiked) and Kaplan.

