
March 22. The FED is who we THOUGHT they were!
–On Tuesday I wrote this: “The market seems to be geared up for a bearish hike, with upgrades in growth projections and a rise in the Fed dots. We had already priced increased growth estimates, and while the market is on the same page as the dots for 2018, the Fed hadn’t been able to hit targets for years prior to now. Maybe the dots will move a bit higher in 2019 and beyond….will initial selling be sustainable?” The FF projection dots DID move higher, from 2.7 to 2.9 in 2019 and 3.1 to 3.4 in 2020. And growth estimates moved higher as well. However, initial selling was NOT sustained, and most interest rate contracts came back and were trading higher at the end of the day. For example, TYM8 printed as low as 119-22 post FOMC, but was trading 120-05 late (and is 120-14 this morning). EDM0 traded as low at 9697.5 (down 8 on the day) but was unchanged at 9705.5 late. The contracts in front of EDM0 were positive, those behind were still slightly lower.
–Huge trade on the day was buying of EDZ9/EDZ0 spread both before and after the announcement. Total volume in the spread was 250k! About 100k were bought pre-Fed, mostly 7.5 to 8.0. After the 2019 FF projection was moved up to 2.9 (signaling 3 hikes in 2019), the spread was further bought from 9 to 10 in 80k. Settled 10.0. (High on 5-Feb VIX blow-up was 16.0). The EDZ8/EDZ9 spread also popped up to a new high of 39, but came back to trade 35.5 late. Settled 37.5. Open interest indicates a new position. OI in EDZ9 +63k and EDZ0 +98k. The whites (or first 4 quarterly contracts) added over 200k of new positions yesterday.
–Another large trade had been buying of 0EM 9700p, with 5’s being bought ref 9717.5 Wednesday morning and 4.5 paid vs 21 the day before. At the end of the day these were 3/3.5 vs 9720/20.5 and settled 3.25 vs 9721.5. Deflation.
–Though front contracts closed positive, lib/ois spread remains bid (though the late rally eased the pressure to some degree). For example, EDM8 vs FFN8 was as high as 49 early in the day, but came back to settle 46.5. I mentioned Deutsche Bank at new lows during the day, but yesterday afternoon friend AOK sent me his missive, (mostly focused on ETFs and equities) which included DB share price overlaid with inverted lib/ois. Correlated. Let’s just say that a higher spread will NOT be welcomed by DB shareholders.
–The dollar fell and gold and oil surged. Gold was +$20 late and CLK8 was up over $2/bbl late to 65.54, only about $1 from the rolling contract high.
–LEI today expected +0.3.
Dennis Green clip especially for Kuhlman, one of the funniest guys I have ever worked with, who has a sports analogy for EVERYTHING!
March 21. FOMC day
–Fed day. Powell’s first as Chairman. The market seems to be geared up for a bearish hike, with upgrades in growth projections and a rise in the Fed dots. We had already priced increased growth estimates, and while the market is on the same page as the dots for 2018, the Fed hadn’t been able to hit targets for years prior to now. Maybe the dots will move a bit higher in 2019 and beyond….will initial selling be sustainable? Jan 2019 FF are already fully priced for 3 hikes in 2018 at 9782.0. Just for interest, FFF20 is at 9742.0, a spread of just 40 bps to FFF9.
–Yesterday yields pushed higher, with tens +3.6 bps to 287.9. Some pressure attributed to inbev’s $10 billion bond issuance.
–One large trade was a buyer of >100k 0EM 9700ps for 4.0 to 4.5, from futures price 9722 to 9721.5. These puts settled 4.0 ref EDM9 9721.5 (exchange volume showed 174k trading). Helped push EDM8/EDM9 to 44.5 (and it was 45 bid late). IF the Fed does raise 2019 and beyond dots, then perhaps a spread of 40 for FFF9/FFF0 is too low, and EDM8/EDM9 is too low, so it makes sense to load up on puts on EDM9. Libor/ois continues to grind higher, with, for example EDM8 vs FFN8 settling at 46.5, out 2.5 on the day.
–Atm green and blue midcurve straddles now identical. Blues had held 2-3 bp premium advantage a couple of months ago. 5/30 notched a new low of 43.1 bps.
March 20. ‘More speed and less capital’
–Subject line quote above is from a BBG article quoting GS.
“Future liquidity disruptions may amplify price declines when the current cycle turns,” wrote Charles Himmelberg, Goldman’s co-chief markets economist. “Trading liquidity may be worse than it looks because trading volume in many major markets is increasingly dominated by more speed and less capital.”
Sounds like the stuff of flash crashes, doesn’t it?
–Yesterday’s session featured little change in interest rates with a bias lower as stocks tumbled. FB pasted -6.8%. SPX -1.4% and Nasdaq -1.8%. The fact that interest rate futures have a hard time rallying in the face of asset price declines likely shows underlying bearishness, though it might just reflect concerns about a hawkish outcome at tomorrow’s FOMC.
–There was quite a bit of futures roll on the ED curve, related to the expiration of EDH8. For example, at least 70k EDU8/Z8 bought from 13 to 14 which appears to be liquidation, both -14k in OI (14.0s). Buyer of 100k EDH9/EDM9 at 11, appears roll with OI -48k and +42k (11.0s). There continues to be heavy buying of 0EM 9700p for 3.5, settled 3.0 ref 9725.5. OI +66k.
–Just to revisit the idea of capital, all sorts of major electronic trading programs are run to end the day ‘flat’. It doesn’t take as much capital, as Goldman notes. It’s like the old-time concept of “just in time” inventory control. On a broader level, I keep circling back to the idea of banking capital. Plentiful in the US, but perhaps the underlying situation in europe is not quite as robust. For example, DB continues to hover near the lows of €12.6. It’s market cap is only 26.5 billion ($32b). As a comparison, JPM has a market cap it $396b. CS has mkt cap of 44b. How can the namesake bank of the most powerful economy in Europe continue to flail around these levels? Excess capital absorbs risk. That is the lesson. Excess capital equals central banks. Does the Fed want to aggressively withdraw capital?
March 19. EDH8 off the board; rolling ED spreads at new lows
–Big event of the week is Powell’s first FOMC meeting as Chairman on Wednesday. There are some concerns that FF projections will move somewhat higher, but there is no shortage of potential news stories that could be identified as market drivers over the next week. For example, domestic political intrigue continues with speculation Trump could fire Mueller. Trade tensions with China are still simmering “…as U.S. Treasury official David Malpass said he misspoke hours after claiming the U.S. was pulling out of decade-old formal economic talks with Beijing.” (BBG). Mnuchin is still holding high level talks with the Chinese. In other central banking news, China named Yi Gang as the new head of the Central Bank (US educated, pro-market reformer). There is some speculation that China wants to be more aggressive in dealing with bad debts and get the pain over with in the short term. On the other hand, the ECB last week postponed implementation of rules for banks to deal with non-performing loans until 2021. (Thanks Joe, for Armstrong link).
At that point it will probably fall into Weidmann’s lap. The bigger theme here is that bad loans and malinvestment, which have lingered since the crisis or been exacerbated by low interest rates, are likely to be addressed in the next couple of years in one way or another by new central bank heads. Probably not a benevolent environment for stocks.
–EDH8 expires today. On Friday US rates moved higher, with tens +2.7 bps to 284.6. Greens and blues were weakest on the dollar curve, closing -4.0. New low in 5/30 at 43.7 bps. With June’19 as the new first red, all rolling pack spreads will be at new lows. Red/green marked at 9.375, green/blue at just 3.5 bps. April treasury options expire Friday. One looming question going forward is whether the curve will bull steepen on a hard stock sell off. I think so, but Powell’s stance on Wednesday may provide clues as to how he might respond to asset drops.
March 17. FOMC WEEK- FED CAN’T CONTROL EVERYTHING
Last week I suggested supply and demand was about to become more important in the treasury market. It’s a good topic, and would have been spot on if I had been talking about short term funding markets rather than longer dated treasuries. Because that was really the story this week, the continued blow-up of Libor/OIS. A Bloomberg article noted the Fed asked about the widening in its most recent dealer survey. This piece continues, citing BAML, “Central bank would be ‘much more concerned’ about the rise in Libor if it reflected increased bank credit concerns rather than supply/demand dynamics at the front end of the rates curve.” Since EDH8 expires Monday, as good a reflection of widening as any is the spread of EDH8 to FFJ8, which settled 55.5. This is out from a low of 41 earlier in the month. On the forward curve, EDM8/FFN8 settled 47, EDU8/FFV8 39 and EDZ8/FFF9 at 38.5. The cited culprits for this widening are repatriation flows and t-bill issuance. Glancing at EEM (emerging market etf), there doesn’t seem to be undue pressure on emerging markets. Recall that in 2015, EM stress forestalled the Fed from hiking in September; Yellen waited until December ‘15 for the first hike of the cycle. In any case, we are seeing evidence of tightened financial conditions throughout the markets. The NY Fed considers short and long term rates, equities, the value of the dollar, and corporate spreads as indicators of stress. All have signaled increased tightening. Even though the curve has flattened, both short and long rates have increased. The dollar has steadied for now, stocks have lost a little air. Many regional Fed banks have their own indicators, and they’ve turned up modestly. I am just going to include a chart from the Chicago Fed.
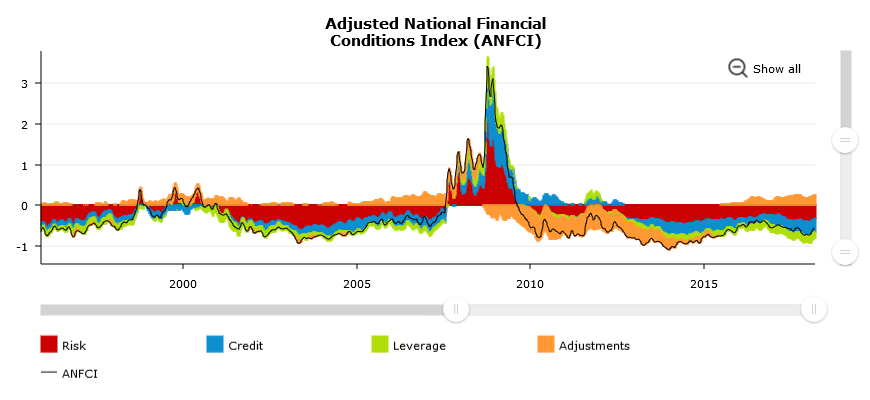
Hard to see, but the black line, which represents Adjusted Nat’l Financial Conditions Index, is edging a bit higher. What is sort of interesting is the orange part of the chart, which is the ‘adjustment’. I’ve isolated that on the chart below. When this moves into positive territory, as it is now, it seems to indicate problems ahead. As I understand it from the Chicago Fed website, this adjustment seeks to put financial conditions in the context of general economic conditions. Probably worth noting.
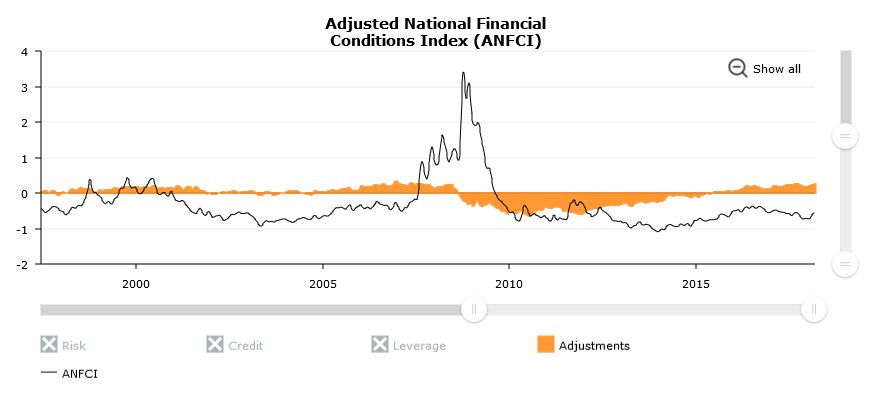
Actually, real time economic data likely provides much the same sort of information. For example, the deceleration in Retail Sales immediately caused downward revisions in Q1 GDP. In the wake of the report, the Atlanta Fed Q1 estimate plunged from 2.5% to 1.9% and then down to 1.8% on Friday. The NY Fed NowCast was also revised to a new low of 2.73%, having been 3.11% one month ago.
This week brings the FOMC. I have seen a few analysts say that the Fed is going to lean hawkishly, and perhaps telegraph four hikes. My only response is, ‘Why would anyone conclude that?’ Financial conditions are tightening. The increase in libor funding rates has already had the same effect as an overt rate increase. If one were inclined to forecast 4 hikes for the year, they’ve got it. January 2019 FF contract trades 9784.0. Given the current Fed effective of 1.42% and FFF9 indicating a rate of 2.16%, the difference of 74 bps indicates 3 hikes. Add in the 25 bp widening of libor/ois and, sure enough, there’s the 1%. Inflation scares have slightly abated, given tameness in average hourly earnings. However, I will note that the NY Fed’s Underlying Inflation Gauge (UIG) increased to 3% at last reading for January, which is the highest it’s been since prior to the crisis. But the Fed is not so narrowly focused.
There is one other little technical note regarding the Fed Effective. It has been as solid as a rock at 142 bps excluding month end, but ticked to 143 on Thursday. April FF traded 9833 Friday, reflecting a fear that Friday’s Fed Eff could also tick higher. Really, FFJ shouldn’t be trading 9833 and the fact that it is indicates another little technical wrinkle, of which we’ve seen many recently.
For example, there were deliveries into UXYH8 this month as the delivery option kicked in. The conversion factor is so low on the Cheapest-to-deliver that the post 2:00pm rally on 6-March when Cohn resigned created an option for the short to deliver and cover the additional long tails for a tidy sum. I’ll also mention the EDZ9 9800 conversion that caused a local kerfuffle last week. Traded 0.5 for call with futures level of 9800. It had settled 1.75, which reflects the carry of 21 months, as the actual futures price was 9711.5. The locals which sold at 0.5 weren’t (amazingly enough) incorporating higher yields over time in their market. Is this trade of particular interest? Not really, one local group picked off a couple of others. The point is, this stuff doesn’t typically happen, and in a way, it’s GOOD. It reintroduces the idea of RISK into financial dealings. Perhaps it’s tied to the thought that central banks are taking a step back from the babysitter role. Higher rates and dislocations make people think twice. Well some, anyway. A result should be higher option premia. This environment makes people say, “Are you sure that’s there?” Whenever I get that question, I say “Let me just double check,” because I’m not really sure of anything in this world.
Quick mention regarding the dollar. It seems to be attempting to base, or at least it isn’t going down from here. The lagged effect of USD weakness over the past year is one of the factors that should drive inflation readings higher. But if US rates continue to rally, then shouldn’t the dollar turn higher? Note that the yield spread between bunds and US tens is 227 bps, which is the high of the year and nearing the peak set in late 2016 of 235. That particular spread hasn’t really had much influence on USD. On the other hand, the yield difference between EDM8 and ERM8 has moved nearly 100 bps in six months. From around 178 bps in September 2017 to 273.5 currently. One would think this widening should support the USD, and, the prospect of increased pressure on the short end could provide a further push. However, think of the converse for a second. What if something happens that causes the US front end to rally? Then USD may be subject to another hard leg down.
_______________________________________________________
| 3/9/2018 | 3/16/2018 | chg | |
| UST 2Y | 226.2 | 229.1 | 2.9 |
| UST 5Y | 265.2 | 264.3 | -0.9 |
| UST 10Y | 289.7 | 284.6 | -5.1 |
| UST 30Y | 315.0 | 308.0 | -7.0 |
| GERM 2Y | -55.6 | -59.1 | -3.5 |
| GERM 10Y | 64.8 | 57.1 | -7.7 |
| JPN 30Y | 76.3 | 75.3 | -1.0 |
| EURO$ Z8/Z9 | 36.5 | 34.5 | -2.0 |
| EURO$ Z9/Z0 | 7.0 | 6.0 | -1.0 |
| EUR | 123.07 | 122.91 | -0.16 |
| CRUDE (1st cont) | 61.92 | 62.41 | 0.49 |
| SPX | 2786.57 | 2752.01 | -34.56 |
| VIX | 14.64 | 15.80 | 1.16 |
https://www.chicagofed.org/publications/chicago-fed-letter/2017/386
https://www.newyorkfed.org/research/policy/underlying-inflation-gauge
March 16, 2018. They’re dying the Chicago River Green tomorrow – does that mean we buy greens?
–Going into the expiration of EDH8 the pressure continues, with new lows in EDH8 yesterday of 9778.75. However, EDM8 did not make a new low, and was 9769 bid late. After the libor setting came out at 2.1775 there was a buyer of at least 50k EDH8 9775p for 0.25. There was also buying of 20k EDJ 9762p for 1.75 and of EDK 9750p for 0.75 (both settled at those prices ref 9770.0). While lib/ois rallied out to new high, the 2 year swap spread fell a couple of bps from 32.4 to 30.1. The curve continued to flatten. Late mark in 2/10 was 54 bps, -1.5. The low set on Jan-4 was 49.7. 5/30 was 43.5 late, the low of the year was 41.9 on Jan 31.
–I got a good question yesterday: what part of the curve rallies hardest If a catalyst sparks a rally. Perhaps it depends on the catalyst. I would say the first two greens, i.e. EDM0 and EDU0. In treasuries I would reckon the 5yr, as 5/10 spread is barely above 20.
–Housing Starts and Industrial Production today with the latter expected +0.4. JOLTS as well, but there’s little concern about the labor mkt at this point.
–FOMC meeting is Wednesday. Dots are expected to go up.
–The one-year euro$ spreads are becoming completely flat. Late marks: EDH8/H9 41.0, EDM8/M9 41.5 and EDU8/U9 39.0. EDZ8/Z9 settled 33.5, so there’s still some positive roll there. Back end of the curve is is flat as it can get without inverting. Green/blue settled 3.875 and blue/gold 3.25. New lows. Also at a new low is EDZ9/EDZ1 at 8.5. Interestingly, even with curve flattening implied vol firmed significantly. Although the tightening at next week’s FOMC is fully priced, the market feels as if it’s gearing up for a big move. March Midcurves expire today.
March 15, 2018. Let the Good Times ….flatten?
–Yields declined and stocks faltered as Retail Sales fell, -0.1%. This data caused several analysts to mark down estimates of Q1 growth. Notably, the Atlanta Fed GDP Now projection plunged to 1.9% from 2.5% on 9-March. The first quarter has printed weak several times in recent years, but given the tax package it’s surprising. The idea of tax cuts sparking sustainable ‘animal spirits’ is becoming questionable, perhaps reflected in the PA election as well (narrowly claimed by the Democrat candidate). Midterm elections were to be dominated by the feel-good effects of tax legislation; are the benefits already fading?
–Tens fell 2.8 bps to 281.3. The curve flattened to new recent lows. 2/10 fell to 55.5 bps and 5/30 dropped over 4 bps to close below 45. Red/gold pack spread eased slightly to a new low of 23. There was a buyer of about 50k FVJ 114.5 calls for 6.5 to 7.0 with FVM trading 114-04 to 04.5. This call settled 6 ref 114-06 as others took advantage of the vol pop to sell lower strike calls on curve trades. April options expire one week from Friday. Previously this call buyer anticipated the large stock sell-off which caused a flight to the belly.
–Also of note were a few synthetic buys of EDZ9. Again, this is the contract with peak open interest of 2.27m contracts. First, there was a seller of 20k EDZ9 9700/9650 put spread at 14.5 (24d) which appears to be a roll down into the lower strike. The following trade is also of interest: +45k 0EZ 9750c vs -30k 3EZ 9725c for a credit of 4 to 4.5 bps. Settles were 9.75 (27d) and 16.75 (38d). 3EZ settled at a credit of 4.25. Trade is slightly long the market, and a synthetic steepener. A similar trade was done in June contracts. What’s interesting here is that this trade can quickly morph into a short position if the curve implodes on a rally. The difference between strikes is 25 bps, but the actual spread over the two years from EDZ19 to EDZ21 is just 10 bps! (9715 to 9705). EDZ8/EDZ9 closed -1.5 at 32.5.
–News today includes Philly Fed, expected 23 from 25.8. Also, TIC data is released this afternoon, perhaps of more interest than usual due to possible trade frictions. On a tangent, the US is claiming steel and aluminum production as vital to national security, while the Chinese are securing uranium and cobalt (Glencore agrees to sell 1/3rd of cobalt production to China). The relevance of various minerals and metals may become a larger topic going forward.
https://www.frbatlanta.org/cqer/research/gdpnow.aspx
March 14. Deflating curve, vol and activity
–CPI was as expected with yoy Core +1.8 and headline +2.2 yoy. Retail Sales expected +0.3 and PPI expected +0.1 headline, and +0.2 Core with yoy Core 2.6.
–Yields eased with a solid 30 year auction, though the biggest piece of news came on the political front with the ouster of Rex Tillerson, which took the wind out of stocks. Vol deflated after the data and the curve flattened. I marked 2/10 at a new low of 58.3 and 5/30 at a new low of 47.7. Red/gold is closing in on 23 bps, and as mentioned yesterday, will likely print a new low for the year as March rolls off the board Monday. The June19 1 yr avg is 9716.625 and the June22 1 yr is 9698.75 so that spread is now just 17.875. As mentioned over the weekend 2EM and 2EU straddles hadn’t declined at all for 5 weeks going into Friday 5-March, ending at 33.5 and 43.5. The market is now catching up, with 2EM 9712^ at 29.0 and 2EU 9712^ 40.5. Likely to see further pressure.
–Front end continues to trade with an anvil around its neck. A March hike is completely priced, but dot projections next week will be of interest. Front end weakness is one factor pressuring the curve, but other issues are also at play. Interesting note on BBG mentions that not a single Japanese ten year traded Tuesday. From the article: “Governor Haruhiko Kuroda noted to lawmakers Wednesday that the central bank has bought 75 percent of the government bonds issued in the fiscal year ending this month.”
March 13, 2018. Front end weakness persists approaching EDH8 expiry
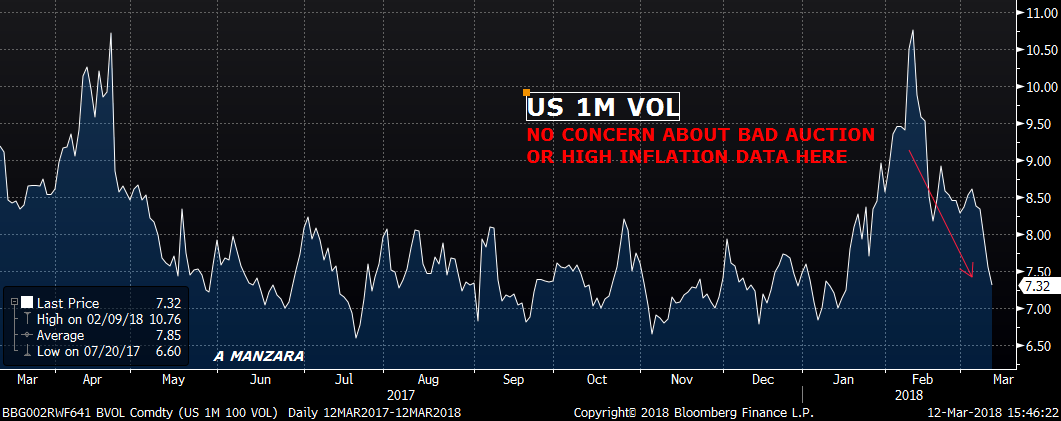
–Treasury supply was absorbed fairly easily with TYM trading a tight range around 120-03 both before and after the auction (Settled 120-06+). Yield was 2.889 with 2.5 bid to cover. Prior to the auction 20k TYJ 120 puts were sold covered 120-03, at 20. So 46 in the straddle, which settled 45. Puts were an exit. Thirty year bond vol was crushed, with USM closing at 7.5, a bit surprising in front of today’s inflation data and auction. (New sales of USM 141p in 6k, closed 0’56 ref 143-23).
–Today’s news includes CPI expected +0.2 both headline and core. Core yoy is expected +1.8, same as last, with headline +2.2.
–On the short end the main feature was continued widening of fra/ois spread. As a proxy the spread EDH8 to FFJ8 closed at 50 (+1.25), having pulled back to 41 earlier in the month. Further out the curve these spreads also made new highs: EDM8/FFN8 settled 42.5, having been 35.5 in early March. EDU8/FFV8 closed 36.5, not quite a new high, and EDZ8/FFF9 closed 37. This latter spread hit 40.5 in late Feb, pulled back to 32.0 on March 2, and has since rebounded.
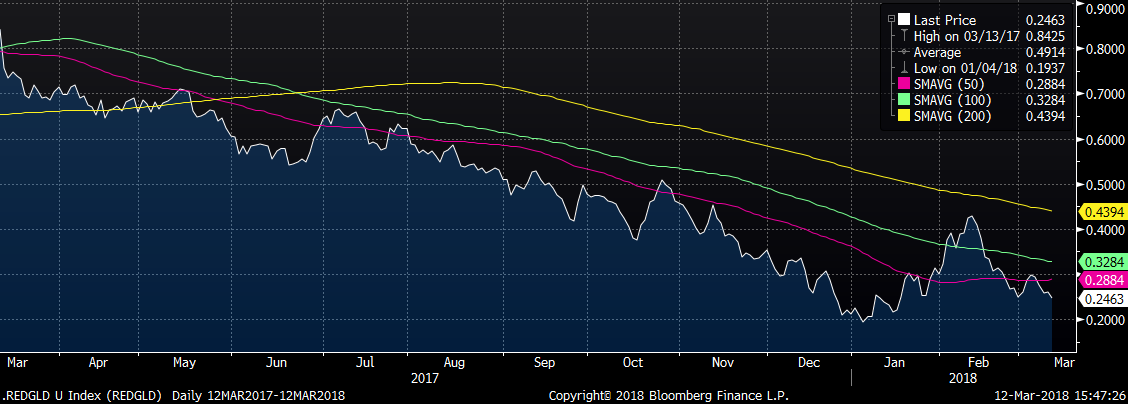
–Front end weakness on the dollar curve has contributed to curve flattening. Red/gold euro$ pack spread ended 24.625, a new recent low and close to the absolute low of 19.25 set in the beginning of January. As March contracts expire on Monday, this spread could easily print new lows on a rolling basis, as EDH19/EDM19 settled 10.5 while EDH22/EDM22 is only 0.5. (Currently the M19 1y pack avg is 9816.5, and the 1y M22 avg is 96.975, a spread of 19.0). Does it make a difference? A flat or inverted curve is often associated with recession. The market already has three hikes fully priced this year with FFF9 printing 9783.5 or 2.165%, 74.5 bps above the current Fed effective of 1.42%. The Fed ‘dot’ projections may take on added importance at next week’s FOMC, especially for 2019 and beyond. The issues going forward are whether the fra/ois spread will revert lower again, and whether the next step-up in QT will start to bite (another $10 billion/month will roll off starting April, $6B treasury and $4b MBS). I believe the new rate is $30b month in total.
(Below charts, top is red/gold ED pack spread and underneath is Bond Vol).
March 12. Auctions and inflation this week.
–Three and ten year notes auctioned today. CPI tomorrow, followed by the thirty year bond auction. Auctions are more important than usual as the market tries to gauge global demand in the face of increased supply.
–NFP of 313k Friday was coupled with a yoy increase of only 2.6% in Average Hourly Earnings, with the previous number revised lower to 2.8 from 2.9. Yields ended modestly higher, with tens +2.8 bps to 289.2. On the euro$ strip, greens were weakest on the board, closing -3.375. Good buying Friday of EDZ8/EDZ9 at 37.0; settled +2 at 36.5. EDZ9 has the most open interest of any contract at 2.175m, having doubled since the beginning of the year. While near calendar spreads rose, the back end of the curve remains flat. For example, greens to blues (3rd to 4th year spreads) settled at a new low of just 5.375 bps. Lack of inflationary pressures (as reflected in subdued wage growth) is helping to keep the back end compressed. At the same time, growth is continuing, with the Atlanta Fed GDP Now at 2.5% for Q1 and the NY Fed at 2.83%. This recipe of moderate growth and low inflation diminishes risks of a more aggressive Fed in the future, and supports equities. In the short term, next week’s FOMC meeting is fully priced for a hike, and June is 75% of the way there, with July FF at 9814.5 (9808.5 represents 100%), and FFK/FFN settled 18.5. Nasdaq soared to a new high on Friday.
–BIS says Canada and China at risk of banking problems, but China has been taking steps to deleverage.
–March euro$ midcurve expire Friday. Auctions and inflation data out this week. 0EH9 9737.5^ settled 6.0, 2EH0 9712.5^ 8.5, 3EH1 9700^ 8.0 and 4EH2 9700^ 7.5.

