
Supply and Demand. Boring until it’s not. March 11, 2018
In the treasury market, I’ve never really bought into the idea of ‘supply and demand’ as a driving factor. After all, we’ve previously been in periods of increased deficits (more supply) that don’t seem to impact rates much at all. I suppose one would argue that other factors were increasing demand at the same time, for example, perceptions of lower future growth. During episodes of QE, increased demand by central banks actually seemed to have more of an impact on stocks than bonds; stocks typically went higher and bonds edged lower. One might conclude that simplistic concepts of supply and demand have little to do with yields; influences are much more nuanced and intertwined. For example, deficits and supply often go up during economic downturns, but the same macro picture also leads to lower rates and demand for fixed income.
Currently we are in a period of rising rates, engineered by both Federal Reserve normalization policy, and increased supply driven by swelling deficits. There are many technical divergences that might suggest yields have pushed too high and are due for a substantial retracement. I’ll mention three.
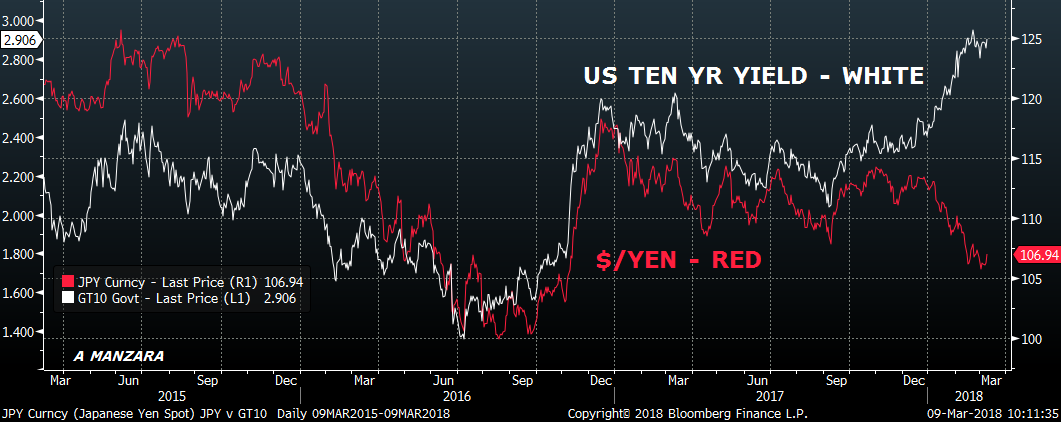
First, the top chart indicates a break in the relationship of $/yen and the ten year yield, with the former moving lower and the latter pressing higher, a stark change since late 2017. Do we necessarily get ‘reversion to the mean’? This divergence might simply signal the idea that Japan may be moving towards the stimulus exit door leading to a stronger yen and less fixed income buying globally. If so, the reversion trade may easily transform into revulsion.
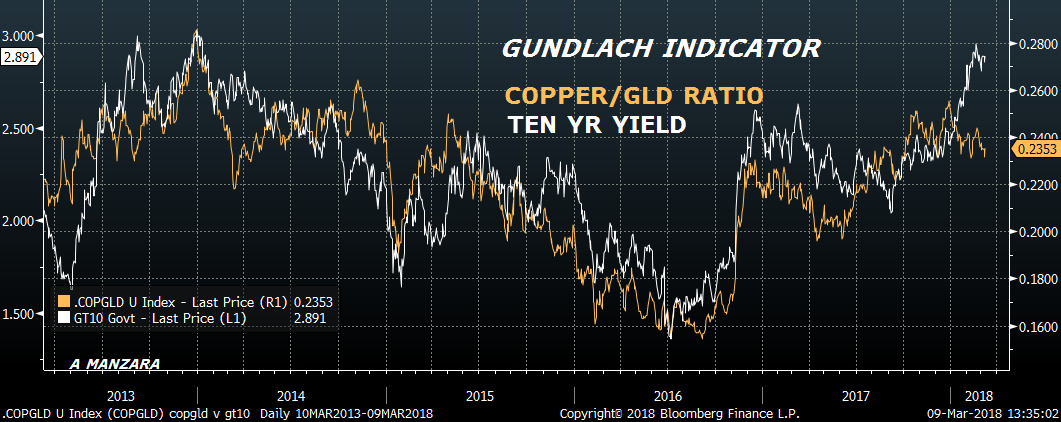
A second, though less glaring divergence concerns a relationship popularized by Jeffrey Gundlach of Doubleline. His arsenal of indicators includes the ratio of copper to gold versus the ten year yield. Makes sense, copper is related to economic activity and gold is a ‘store of value/flight to quality’, so as this ratio goes up it would generally correlate to ten year yields. The chart is below. The copper gold ratio peaked right at the end of 2017, but yields have continued to move higher.
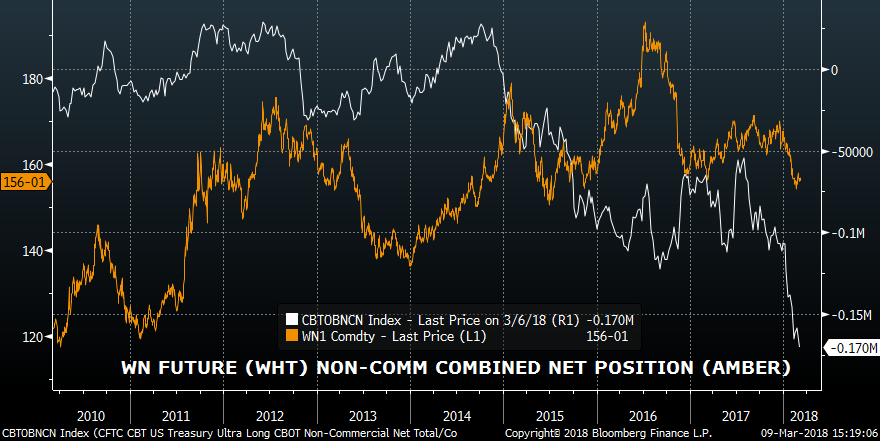
Third, I consider the Commitment of Traders (COT) reports. I don’t personally weight this data heavily, because I think it’s a lot more valuable for commodities than financials, but I’ve cherry-picked a chart to include here anyway. The white line is the non-commercial (spec) net position, a record short in the Ultra Bond. The amber line is the continuous front ultra bond contract (WN1). Specs are hugely short. Does that necessarily lead to a rally? Dunno. **By the way, the chart is mis-labeled, Amber is the color of the futures price.**
Looking at these three indicators, one might determine that the rise in yields has gone too far. Reviewing the historical record, one could further support the above conclusion. For example, many commentators have compared the current environment to 1987. Mostly, they are talking about stocks, noting that the market rallied even in the face of rising rates, but then crashed. Here, I will just focus on the ten year yield. In early 1987, the ten year had bottomed just above 7%. The Fed was tightening, and the yield peaked in Sept 1987 just above 9.4%. Cumulative move was 240 bps, an increase in yield of about 35%. Yields then fell of course, in the aftermath of the crash. [Using data from St Louis Fed].
There was another notable rate increase in 1993/1994. In 1993 the Fed left the overnight rate at the then historic low of 3% for over a year. In 1994, an aggressive hiking schedule commenced. The ten year yield bottomed at 5.7% in Sept 1993 and topped just under 8% in Nov 1994. Cumulative move 230 bps, an increase of around 40%.
The tightening associated with 2004-2006 was much more drawn out. The ten year yield bottomed at 3.3% in June 2003 and topped at 5.1% in 2006, for a total of 180 bps, an increase of about 54%.
In the current cycle, the low yield associated with Brexit was just under 1.5%. The yield has just about doubled, closing on Friday at 2.89%. Shall we focus on the cumulative change of 140 bps and figure there’s another 100 bps to go in order to reach the 240 bp rise of 1987? Or do we say that a doubling of rates in an environment of huge debts is already punishingly overdone? By the way, this move is more or less a replay of 2012 to 2013, when the yield rose nearly 140 bps from August 2012, (1.68%) to the end of 2013, around 3%.
In the very short term, the Treasury auctions 3 and 10 year notes on Monday, followed by the 30 year bond on Tuesday. Given the resignation of Gary Cohn and an increase in protectionism, there is some concern that Asia might go on a buyers strike. If I were China, I would make a point by selling reserves this week. In the very short term, supply and demand takes on heightened importance. Also this week, CPI is released Tuesday with yoy Core expected 1.8%, same as last month. Retail Sales and PPI on Wednesday with PPI yoy Core expected +2.6%.
In the final analysis, yields are driven more by macroeconomic factors than treasury supply. We are in an environment where macro factors are lining up with supply considerations to produce a bearish outlook on both counts in spite of short term technicals. Friday’s strong nonfarm payroll increase of 313k didn’t spark a large sell-off because the market is already short, and was looking for confirmation of wage pressure with Average Hourly Earnings growth. YoY AHE was only +2.6%, a deceleration relative to last month’s 2.8% rate, so weaker shorts pared positions.
In conclusion, while there are several technical indicators that portend a short squeeze, I think inflationary concerns coupled with QT will dominate, and yields will continue to press higher. As an aside, while we know that demographics and debt where of a much different composition, I’ll bet the generation of 60 years ago, with an identical ten year yield of 2.9% in 1958, could scarcely have imagined the bond bear they were about to experience, culminating in a yield over 15% in 1981.
OTHER MARKET TIDBITS
It was a pretty big week for calendar spreads in Eurodollars. Near term spreads continued to press higher, but the back end of the curve compressed. As an example, EDZ8/EDZ9 spread rose 4 bps to 36.5, while EDZ9/EDZ0 fell 1.5 to 7.0. As mentioned, EDZ9 has become the elephant in the room, with open interest of 2.175 million. Since the start of 2018, the open interest in this contract has more than doubled! Heavy buying in EDU8/EDH9 spread from 24 to 25, settled 25.5. (This appears to be a roll of shorts to EDH9). Also heavy buying in EDM8/EDZ9 and EDZ8/EDZ9. The short in EDZ9 appears to be in strong hands. The peak one-yr spread is EDH8/H9 at 48.25. EDH8 expires in one week; EDM8/M9 is 47.0.
Over the previous 5 weeks, green midcurve straddles have not declined in premium at all. (Thanks for pointing that out BC). For example, On Feb 2, 2EM 9712.5^ settled 33.5 vs 9715.5 and on March 2 it settled 33.5 vs 9717.0. No time decay. On Friday, 2EM 9712.5^ settled 30.5 vs 9708. The long dated EDM20 straddle actually rose over the time period: 70.0 on Feb 2, 73.25 on March 2, and 76.25 on Friday!
_______________________________________________________
| 3/2/2018 | 3/9/2018 | chg | |
| UST 2Y | 223.4 | 226.2 | 2.8 |
| UST 5Y | 262.0 | 265.2 | 3.2 |
| UST 10Y | 285.3 | 289.2 | 3.9 |
| UST 30Y | 312.6 | 315.9 | 3.3 |
| GERM 2Y | -55.2 | -55.6 | -0.4 |
| GERM 10Y | 65.1 | 64.8 | -0.3 |
| JPN 30Y | 75.8 | 76.3 | 0.5 |
| EURO$ Z8/Z9 | 32.5 | 36.5 | 4.0 |
| EURO$ Z9/Z0 | 8.5 | 7.0 | -1.5 |
| EUR | 123.21 | 123.07 | -0.14 |
| CRUDE (1st cont) | 61.25 | 62.04 | 0.79 |
| SPX | 2691.25 | 2786.57 | 95.32 |
| VIX | 19.59 | 14.64 | -4.95 |
Note: One ED one-year spreads I switched to Dec contracts as they have the largest volume and open interest
March 9. AHE bigger than NFP?
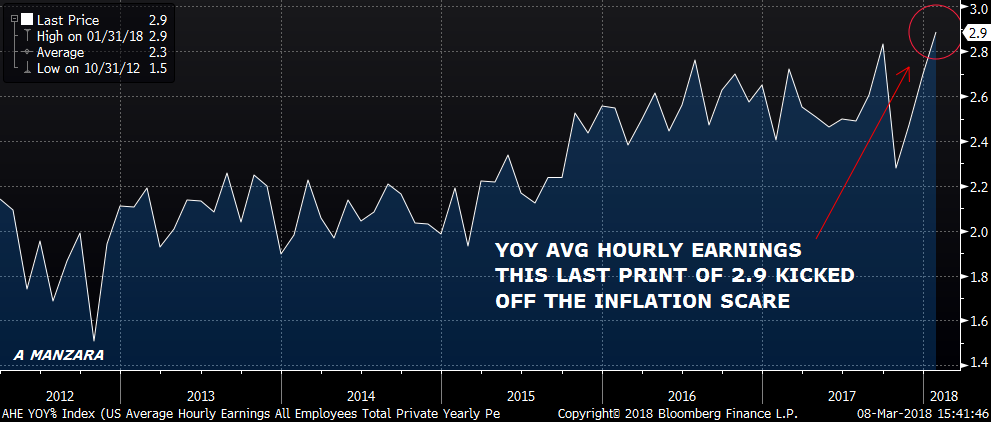
–Employment report today with NFP expected 205-210k and Average Hourly Earnings +0.2. Last month it was the +2.9 yoy increase in earnings that sparked inflation concerns. While TYM has been consolidating around the 120 strike, red and green eurodollars have been edging lower in front of this morning’s data. Late buyer of about 50k 0EJ 9712/9700 put spread for 1.5 ref 9728.5 in EDM9. For a long time, the first red couldn’t break through the 9800 strike (EDM9 will be the first red in a couple of weeks as march expires).
–Ten year yield down 1.7 to 286.4. While net changes weren’t particularly large yesterday, activity was fairly heavy in eurodollar calendar spreads, and seems to reflect a view (at least over next couple of years) of ‘don’t fight the Fed’. The trend is for higher yields. For example, there was an early buyer of 20k EDU8/EDH9 24.0/24.5. This trade almost looks like buy of one hike with a free option on another for the six month period (and no, it’s not that easy). There was also a buyer of 30k EDZ8/EDM9 for 20.5 in 30k. Finally, a buyer ot 10k EDM8/EDZ9 for 59.0. Some of these trades appear to be rolling out of short fronts and adding to shorts further back. For example, EDU18 open interest fell by 16k. However, the contract with the most open interest on the curve continues to be EDZ19 with a whopping 2.145 million open. Next largest are EDZ8 with 1.89m and EDM8 with 1.63m. EDZ9 settled 97.15 or 2.85%. This is less than 75 bps higher in yield than the soon to expire EDH8 contract… so only 3 more hikes? One might consider it ‘expensive’ in the context of increasing inflationary pressures.
–Auctions of 3 and 10 year notes on Monday. 30 year bond auctioned Tuesday.
March 8. Moving toward trade wars
–In spite of Cohn’s resignation late Tuesday, markets calmed by Wednesday morning and net changes were small. Rates edged marginally higher. Big trade of the day was a new buyer of 50k EDM9 9712.5p for 14.5 vs 9729.5 with 38d. Straddles from EDM9 back settled up 0.5 to 1.5 higher. EDM9 9725 straddle closed +0.5 at 44.5. The green pack 9712 straddle strip had been sold at 306 a couple of days ago but settled 312.25 yesterday. Third day in row TYM settled 120-01 and that straddle closed at 2’00 (4.5 vol).
–ADP was better than expected 235k. Nothing unexpected out of Beige Book…’prices increased in all districts’.
–EDZ8/Z9 settled 34.5 +0.5 on the day, but EDZ9/EDZ0 flattened by 1 bp, closing at 8.5.
–Bloomberg reports that the US is considering broad curbs on Chinese imports. China’s response may or may not be to sell treasuries, but we’ll be able to gauge the appetite at auctions Monday and Tuesday of 3’s, 10’s and 30’s. Bond contract appears vulnerable to further downside, and with 5/30 mired around 50 bps which is a support area, risk to the bond yield appears skewed higher. Employment report tomorrow. ECB today with Draghi expected to remain cautious on forward guidance.
March 7. Old headwinds fade, new ones emerge.
–The big news is Gary Cohn’s resignation, which increases odds of a trade war. Brainard’s speech (…Headwinds Shift to Tailwinds) tilted hawkishly, concluding that “Continued gradual increases in the federal funds rate are likely to remain appropriate…” She mentioned the weaker dollar, tight corporate spreads, equity valuations and fiscal stimulus, synchronized global growth.
–Equities had a sharp sell off after the Cohn news but remained above the low of last week, and treasuries rallied, but again, held below last week’s high. What appears to be increased isolation of Trump could develop into a larger story, which should provide more volatility going forward.
–Yesterday’s action was relatively muted, with yields edging higher. Treasuries were more or less unchanged, but the Green pack in the euro$’s (3rd year out), closed -2 on the day. Once again, the volume leaders on the ED strip were December contracts, with EDZ8 having volume of 362k and EDZ9 352k, 100k more than other contracts. There was buying of both EDZ8/EDZ9 spread and of EDZ9/EDZ0 spread. The former closed at 34.0, up 1 on the day, and the latter settled unchanged at 9.5, though there was a buyer of >20k at 10 late in the day which appears to be new. We are exactly 2 weeks away from the March FOMC meeting which will include new economic projections. Some may be wagering that deferred FF ‘dot’ estimates will be raised given fiscal stimulus measures. With just over one week before March midcurve expiration there were some straddle spreads traded, rolling from long March premium to June. 2EH and 3EH straddles were pressured, closing at 12 and 13.
–Next week we have treasury auctions of 3, 10, and 30 year paper. These auctions are bunched up in the beginning of the week, with 3’s and tens on Monday and 30’s on Tuesday. Today’s news includes ADP, Internat’l Trade, and the Beige Book in preparation for the upcoming FOMC. Comments by Dudley and Bostic as well.
March 6. Global trade is dominant theme
–Having rallied after the Italy election results, treasuries all closed down on the day. Ten year yield ended 287.9, up 2.6 bps. Once again there was heavy buying of TYJ 120/119.5 put spread on a roll up, paying 9 to 10 covered 120-125. Open interest rose 31k in 120’s to 159k and fell 20k in 119.5s to 162. Put spread settled 13 vs 120-01. In dollars there was a buyer of 100k EDH9 9675p for 1 covered 9741 to 9744. In the past week there was large buying of EDZ8 9725/9712ps for 1.75, which is a 4-hike play; the EDH9 puts are 50 bps lower, so perhaps a bit aggressive.
–EDZ8/EDZ9 traded as low as 30 but came back to settle 33, +0.5 on the day.
–Focus continues to be on trade tariffs and adjustments with NAFTA. The EU is readying retaliatory tariffs. Canada dollar weakened to a new low against a backdrop of worsening news. For example, Armstrong Economics notes that Foreign investment in Canada has dropped 26% due to measures taken to curtail China’s property buying and also due to diminished capex in the oil industry (thanks Marco). An article on ZH notes heavy household debt loads in Canada. Like everyone else, I’m waiting for a bounce to sell.
–Kuroda softened the talk of BOJ exit (if inflation achieves the 2% target). News in the US today includes Factory Orders, expected +1.7. Fed Governor Lael Brainard speaks at 7:00. Though she mostly leans to the dovish side, the last voice of the “Yellen Fed”; her speeches are always even-handed.
March 5. Non-Commercial Specs in Tens… net short
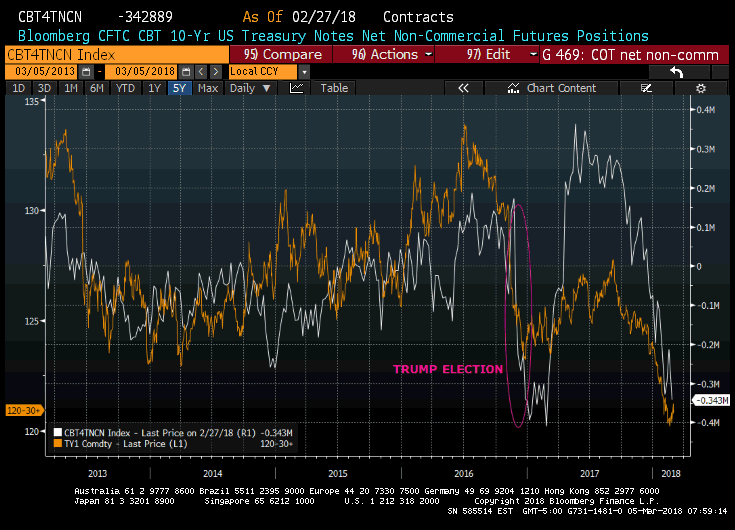
A friend sent COT net non-commercial position in TY (thanks KW), which I have overlaid with the front contract in TY. The last time the net short was this extreme was after Trump’s election, and a rally ensued as shorts were squeezed out. Is the same price action in the offing this time around? Certainly the TY contract appears to have had a technical breakout to the downside, and increased treasury supply in well known.
Just something to bear in mind….
March 5. Employment week
–The populist wave continued in Italy with a surge in votes for Five Star and League. The euro absorbed the news easily, US stock futures tested last weeks lows but have rebounded as well. Rate futures are seeing a small bounce from Friday’s sell off. Tens rose 4.3 bps Friday to 285.3. Blues and golds were the weakest on the dollar curve, -6.25 and -6.5.
–China affirmed a growth goal of around 6.5%, while committing to de-risk the financial sector.
–Large trade Friday was buyer of 100k EDZ8 9725/9712 put spread for 1.75. This trade represents a 4 hike scenario. Recall that EDZ17 settled just above 9837, so with 4 hikes, EDZ8 would be expected around 9737. Indeed the 9737 strike was initially targeted before lib/ois spread widened, and there had been selling of the 9725 strike as it seemed out of play. Targets have now been set lower; EDU8 9750/9737ps is also seeing buyers having settled 2.25 vs 9767.5. On the long end there was a size buyer >50k TYJ 120/119.5 ps (30k block 10 vs 120-16). Settled 12 vs 120-06, appears to have been a roll-up as OI declined 16k in 119.5p to 182k (still the peak OI strike) and gained 50k in the 120 strike to 128k. Also a new buyer of 25k TYM8 119p which settled 36 on open interest increase of 22k. There are a couple of lows in TYM just below 119-16 from late Feb. Employment data is Friday which could provide a test of the 3% yield.
–Today’s news includes non-mfg ISM, expected 59.9 from 58.8.
March 4. Ch-ch-ch-changes
Every time I thought I’d got it made, It seemed the taste was not so sweet. -David Bowie/Changes
We put the cart of asset prices before the horse of enterprise. Jim Grant, Nov 2014 speech
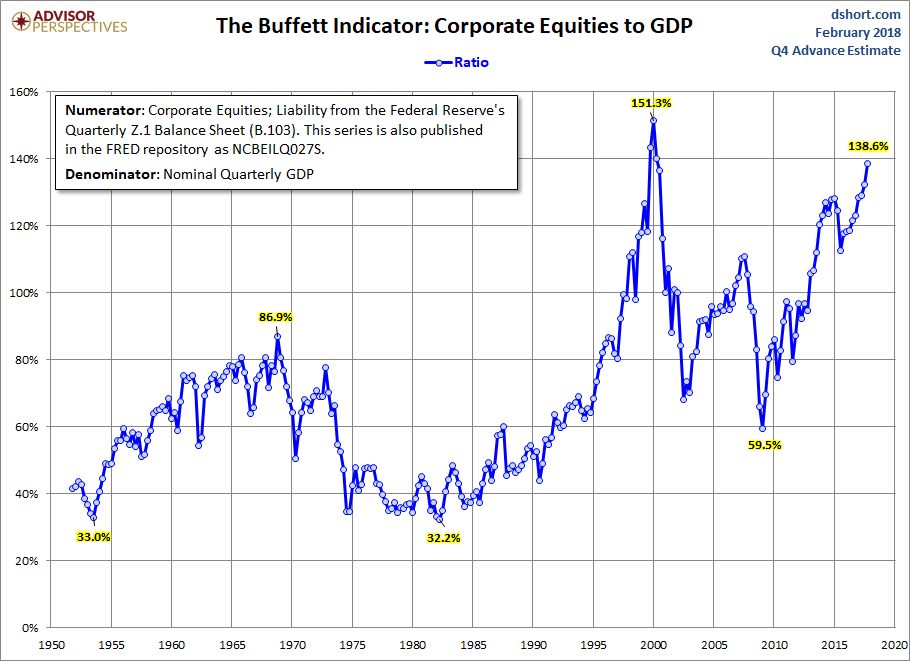
Chart above is from Advisor Perspectives, market capitalization to GDP. The dotcom high was 151%, the last reading on this chart is 138.5 from early February, but the latest figure is actually 141%. Clearly, with interest rates low, there is justification for higher asset values relative to growth.
However, there are a lot of changes occurring. It’s worth noting that week to week differences weren’t particularly large. While stocks were moderately lower, Nasdaq and Russell were only down around 1% on the week, with spirited rallies on Friday. The five year note was nearly unchanged at 3.126%, tens were -1.7 bps to 2.853% and the thirty year bond -3 bps to 312.6%.
The changes are the following: First, Powell’s testimony indicates de-emphasis of asset prices as a determinant of the real economy. Second, the US is pushing for trade changes that could blow-up into a war. Third, China is addressing large financial imbalances. Fourth, central banks are less stimulative and rates are edging higher. Fifth, inflation pressures are building.
Powell’s dismissal of stock valuations is going to put the Fed on a collision course with Trump, even though Trump’s tariffs were the primary catalyst for selling pressure last week. Just for good measure, Trump also threatened a retaliatory tax on European autos. The tariffs are putting the US on a collision course with China. While China said it doesn’t want a trade war with the US, there is some speculation that both Japan and China might sell US treasuries in response. From a Reuters article, one portfolio manager said “They already own a lot of them. They would be shooting themselves in the foot.” Just standing aside and watching the US degrade its own fiscal position with huge treasury issuance might also be considered as shooting oneself in the foot. Supply is coming from the US Treasury and from the Fed through QT. All against a backdrop of a weaker dollar and potentially higher inflation. If there were ever a time for China to make a point with sales of reserves, this is it. The wind is currently at her back. It’s not as if Xi has to worry about political backlash as he is now President for Life. A bigger issue for China is cracking down on financial excesses within its own economy (which may reverberate globally as China has become a larger slice of world GDP). In terms of Japan, Kuroda said last week that the BOJ might consider an exit to its stimulus in late 2019 as inflation approaches target. In short, there is really nothing in the week’s news that is particularly friendly for asset prices.
Once again I am going to mention Gundlach’s question: “When the next recession hits, will it be bond friendly?” Robust growth is not likely to be good for bonds; we already know that. The total duration of US marketable debt outstanding is now near a record of just over 70 months (the historical average since 1980 is 59.5 months). Even a fall in equity prices might not be supportive of bonds in the current environment. There are some indications that shorter maturities might benefit from a stock swoon, but the market is still setting up for continued hikes. For example, there has been heavy buying of EDU8 9750/9737 put spreads, and on Friday, there was a buyer of 100k EDZ8 9725/9712 put spreads for 1.75. This latter trade reflects a view of 4 hikes by year end.
News this week includes the outcome of Italian elections. Brainard speaks on Tuesday evening. Employment report on Friday.
March 2, 2018. The Mothra of all tantrums
–(RTRS) “The BOJ’s board members expect that prices will reach 2 percent around fiscal 2019. If this happens, there’s no doubt that we will consider and debate an exit,” Bank of Japan Governor Haruhiko Kuroda told parliament.
BoJ has been the poster child for QE in massive breadth and scale. Tiptoe towards the exit? Expect the Mothra of all taper tantrums! New high for yen. Probably an invitation to sell Nikkei (and every other risk asset in the world).
–Yesterday’s stock sell off mainly attributed to Trump’s tariffs on steel, aluminum. On the bright side, it’s only a TRADE war.
–While PCE prices were benign with yoy at 1.7 and Core of 1.5, the Prices Paid component of ISM Mfg was 74.2, the highest since 2011.
–However, yields took a dive, with tens falling 5.8 bps to 281. Greens were the star performers, settling +10.25 bps. New low in red/green pack spread to 14.75 (down -0.875). EDZ8/EDZ9 spread settled 31.0, -1.0. However, back end of curve is flat-lining: Z9/Z0 is just 7.0 and Z0/Z1 5.0.
–Light on domestic news today, but Italian elections are this weekend. Grab a bottle of your favorite Barolo and watch the fireworks (and skip the Oscars).
–Unemployment report is one week from today.

Bonus round: fascinating article link:
The brochure listed the odds of various correct guesses. Jerry saw that you had a 1-in-54 chance to pick three out of the six numbers in a drawing, winning $5, and a 1-in-1,500 chance to pick four numbers, winning $100. What he now realized, doing some mental arithmetic, was that a player who waited until the roll-down stood to win more than he lost, on average, as long as no player that week picked all six numbers. With the jackpot spilling over, each winning three-number combination would put $50 in the player’s pocket instead of $5, and the four-number winners would pay out $1,000 in prize money instead of $100, and all of a sudden, the odds were in your favor. If no one won the jackpot, Jerry realized, a $1 lottery ticket was worth more than $1 on a roll-down week—statistically speaking.
“I just multiplied it out,” Jerry recalled, “and then I said, ‘Hell, you got a positive return here.’”
http://highline.huffingtonpost.com/articles/en/lotto-winners/
March 1. How long before Trump blames Powell?
–Don’t worry stock market investors, Hope Hicks will find another job! Yes, Trump’s Communications Director resigned. Perhaps now messages from the White House won’t be as smoothly scripted. On a more serious note, political turmoil could begin to have some market impact, along with announcements like the expected tariffs on aluminum and steel. When I saw the Hicks news ESH was trading 2717, though most selling yesterday was apparently due to month end rebalancing. How long will it take for Trump to blame Powell for diminishing the $6 trillion in stock market wealth that he created? I’ll take the ‘under’ on April 1.
–Once again the eurodollar curve flattened. Red/gold pack spread settled 25, down 2 on the day. Reminder, the low print on Jan 4 was 19.375. Green to blue pack spread (3rd to 4th years) closed at just 5.75 bps; most three month spreads from greens back are now around 1.5 bps. Precursor to an inversion as Powell takes the stage again in front of the Senate?
–Front end continues to trade heavy. For example, there was a buyer yesterday of April and May 9750 put strip (2x J and 1x K) for 1.0 vs 9771. It wasn’t long ago that the market targeted certainty for a June hike at 9787, where March is currently. Now buying protection another 20 bps lower!?!
–There appears to have been modest liquidation in EDZ8/EDZ9 spread yesterday as both contracts lost about 10k in open interest. Spread traded 31.5 before closing 32.0 (-2.5 on the day). High print has been 38. On Powell’s testimony Tuesday the high was 35.5. In terms of Powell, I don’t expect him to walk back anything he said Tuesday. After all, the stock market is not the economy…
–Confidence is high, stocks have been strong. However, FT reports that overdue credit card debt has hit a seven year high (although, in checking source FDIC data, charge offs for other loans including mortgages and commercial fell slightly).
–Aside from Powell Q&A with Senate, Personal Income and Spending (+0.3 and +0.2) with PCE prices today. YOY PCE prices expected 1.7 with Core 1.5. ISM mfg expected 58.7 from 59.1, and ISM prices paid expected 70.0 vs 72.2.

