Feb 27. The Powell Show
–Once again, ED curve flattened quite a bit. EDM8 settled 9774 (-2 on the day), EDM9 9733.0 (unch’d), EDM0 9716.5 (+1.5), and EDM2 9709.5 (+2.0). EDM8 9800c settled 1.0 and 0EM 9800c settled 1.0 as well. That spread was offered flat during the day; that is, one can buy the front June calls flat. (trade has been done in size but the front leg was buying 9800/9825c 1×2). FFF9 came back down to settle 9788, -0.5 on the day and just 5 bps away from certainty of 3 hikes over the year. Red/gold euro$ pack spread settled -2 on the day at 27.375; beginning to approach new lows.
–Big event today is, of course, Powell’s testimony. Text will be released at 8:30 and his appearance is at 10:00. The market has three hikes priced, exactly what the dots reflect. I think Powell will do his best to chart a neutral course, and he will express confidence that inflation will reach target. I wouldn’t be surprised if he downplays stock market volatility (he’s sure to be asked about it), which may be construed as slightly bearish. I would guess he will sidestep most questions about the Federal budget deficit, aside from expressing general concern. Probably won’t be anything that would be bullish for rate futures, although if he leans too hawkishly, we may see more flattening. Chance that press conferences are announced for every meeting to improve communication?
–Warren Buffet has been in the news recently, with a few articles about Berkshire’s massive t-bill hoard which is over $100 billion. One article mentioned that dealers go to Berkshire for specific maturities due to huge inventory. Apparently, part of the reason for severe pressure on the front end of the curve is related to large issuance of bills. And it sounds as if Buffet is itching to do a big swan song deal; he was mentioning buying parts of GE if he could do so at ‘the right price’. Well, GE’s total market cap is now $125 billion, just about the size of Berkshire’s bill holdings. I am not suggesting a purchase of GE, just thinking how much more pressure will be applied to the short end if Buffet does do a big deal and peels off a few bills to pay for it.
Feb 26. Curve is throwing a curve
–There are a lot of synthetic steepeners out there in eurodollar options, mostly long nearer calls and selling deferred, but the curve flattened Friday. EDH8/EDH9 is still the peak one-year calendar but that settled at just 48.5 Friday, down 3.75 on the day. The front March contract, EDH8, is clearly under pressure so perhaps it’s not worth reading too much into this spread being below 1/2%. After all, January FF at 9788.5 are 69.5 bps above the current 1.42% Fed effective rate, so that contract indicates close to three hikes for 2018. The red/green euro$ pack spread closed at 16.25 on Friday, -1.625. In the beginning of Feb this spread was over 21.5. Red/gold pack has declined over 13 bps from the high of the month to 29.5. I have favored being long curve, but the market appears to be thinking that 3 or 4 hikes this year, along with restraint associated with QT, will slow the economy within a couple of years. So, the back end of the curve may be more responsive to inflation (which I think will surprise to the upside).
–Interesting new trade Friday was a buyer of 60k EDM9 9725p vs sold 31.5k EDZ9 9725p at prices 17.5 vs 33.0. This is new position, OI +75k and +45k. Settles 17.25, 44d vs 9733.0 in M9 and 33.0, 53d vs 9718.5 in Z9. So this trade is a flattener and short the market. It’s also selling puts on the ‘cheapest’ contract on the board, EDZ9 (cheap in terms of butterflies).
–Powell speaks tomorrow. Today’s news includes, Chgo Fed Nat’l Activity, New Home Sales and Dallas Fed.
Feb 25, 2018. Showtime for Powell
The past week saw new highs in US yields, new highs in many Eurodollar calendar spreads, a new high in fra/ois, all associated with the release of the FOMC minutes on Wednesday. From there, everything pulled back slightly into Friday. Week over week changes in rates were relatively small; tens were down 0.5 bp to 2.87% after nearing 3% on Friday, and the 30 year bond was up 2.2 bps to 315.7, having tested the high of March 2017 of 3.22%. Stocks were up modestly and oil gained $2, having erased half the recent sell-off which coincided with the stock market decline. Lumber posted new highs with the March contract up 28% since December.
I think China’s takeover of Anbang Insurance Group is hugely important as a signal of coming to grips with runaway credit growth, malinvestment, WMP’s and shadow banking. It’s likely negative for growth in China and therefore global growth. The Great Financial Crisis was made in America, but there’s little concern that reining in China’s explosive growth in debt can spill over into the rest of the world. So for now, the market more or less ignored the Anbang news, which will likely be overshadowed by events this week. On Tuesday, Powell testifies before Congress in his new role as Fed Chairman. On Thursday PCE price data is released. Italian elections are March 4. Note that Employment data is NOT Friday, but rather March 9.
In terms of Powell’s testimony, we might get clues as to how much support the Fed is likely to give asset prices if they decline…will we hear an echo of Dudley’s ‘small potatoes’ remark? There may be some clues as to how many hikes occur in 2018, though the market seems fairly comfortable with 3 or 4. Jan’19 Fed Funds at 9788.5 are 69.5 bps above the current Fed Effective of 142, so just under 3 hikes are priced. The big longer term issues are 1) Inflation 2) Fiscal sustainability of the Federal Budget, and 3) Policy options for the next recession.
In terms of inflation, concerns in the market have been accentuated this year due to the wage growth component of the last Employment Report (+2.9 yoy), which was followed by a strong CPI number. Mnuchin this week said wages can go up without sparking inflation, which is to say that rates should (hopefully) stay low so that the US can finance expected gargantuan deficits without debt servicing costs toppling the apple cart. Powell may take issue with that scenario. The US is certainly seeing growth related to the tax plan, but there is no question that deficits will grow, and need to be funded by treasury issuance. This leads to the last concern, which is how the Fed will deal with the next recession. This is a large looming issue, though I doubt it will receive much emphasis in Congressional hearings. For now, I’ll cite Dudley: (RTRS) Still, as William Dudley, president of the New York Fed, said at the conference, the ability to again purchase bonds if and when rates hit zero “seems like a good tool to have.”
In my personal opinion, it’s all a bit circular and relates back to the idea of the ‘Fed put’ and moral hazard, writ large. Paraphrasing: The Fed can buy treasury debt to monetize the unsustainable (according to many Fed officials) fiscal deficits, thereby supporting financial asset prices which are the mainstay of the economy.
Gundlach was on CNBC Friday, and said that Doubleline was noodling around an interesting question: (exact transcript is posted at bottom) “When the next recession hits, will it be bond friendly?” He notes that there will be huge amounts of debt issuance related to fed’l budget deficits and QT, and, with the addition of corporate and junk bonds and bank loans, it will total approximately $2 trillion annually in supply. Obviously, Doubleline has concerns that a recession may NOT help bonds.
It’s really all about confidence. I think the decline in the USD over the past year is a reflection of that. I am not talking about business confidence which is clearly high, but rather integrity in the financial global architecture. So when the Fed says the lack of inflation is a mystery, or that they really don’t know what causes long term shifts in productivity, I think it chips away a little bit of that confidence, which makes Powell’s appearance fairly important. As a small aside, I would note that during the 1994/1995 hiking campaign, the dollar index fell as well (with a notable rally in Q4 1994) and did not bottom until the last hike in Feb 1995.
What are bond prices really reacting to? Inflation? Inflation expectations? Growth? Deficits and supply concerns? Fears that trading partners may be less willing to finance US debts given the administration’s resolve to ‘level the playing field’ with tariffs and other measures?
Below is a picture of PCE Prices. Core is in white. We don’t have to worry about where it is right now. It’s where it’s going to go.
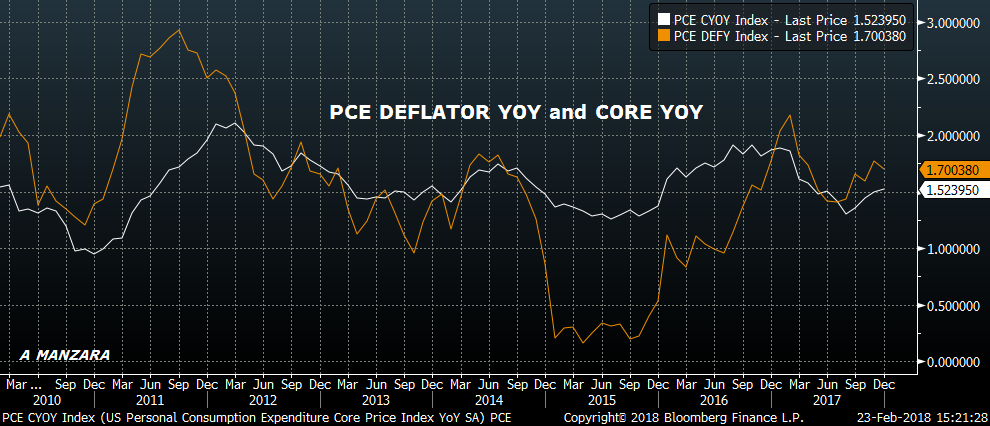
We now have many analysts coming out with their reasons inflation can’t go higher. Most center on demographics and productivity. These papers are like having the baseball game on the radio on a warm summer day while doing lawn work. Background noise. There are a lot of reasons that inflation CAN accelerate that have nothing to do with longer term demographics and a lot to do with policies and confidence (or lack thereof) in them. See lumber.
Two weeks ago on Feb 12, many measures of the curve peaked and have been flattening since. For example, 2/10 on 12-Feb was 78 and is now 63 (in part due to new 2 year). Red/gold euro$ pack spread went from 42.75 to 29.5. The fact that tens didn’t pierce 3% and bonds didn’t quite get through last year’s high, along with the flatter curve, are factors that tend to support stocks. However, in spite of last week’s bounce in the short end on Friday, funding issues are still lurking. I would note that both June euribor and short sterling closed at new recent lows on Friday. Not much of an issue in euribor, but June Short Sterling was 9930 in early February and 9914 on Friday, a significant plunge.
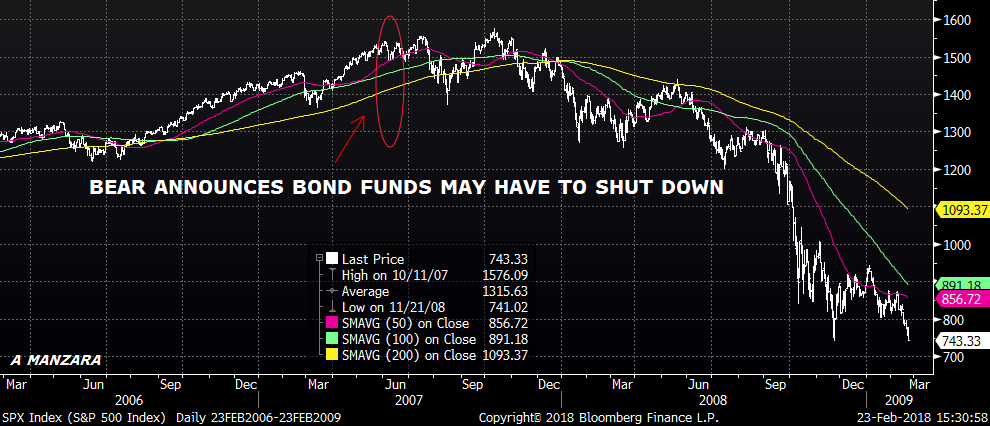
There’s no end of material to cover, but I am going to wrap up with a couple of addendums. First, regarding the ongoing crackdown related to financial stability in China, Anbang reminds me of when news came out that Bear Stearns would have to shutter two (mortgage related) bond funds due to massive losses in June 2007. It was a like waving a flag and ringing a bell at the same time. Stocks faltered slightly, ran to new highs, had a deeper sell off, and then ultimately peaked 4 months later in October. In October of last year, PBOC’s Zhou Xiaochuan warned of the risks of a “Minsky moment” in China. Evidence is mounting. Below is a picture of Bear Stearns news in 2007.
One other note. Geopolitical issues seem to have moved to the back burner recently. However, the British Defense Sec’y announced a couple of weeks ago that the HMS Sutherland, a warship now in Australia, would sail through the South China Sea next month, “…making it clear our navy has a right to do that.” I assume that will be in early March, and I suspect the South China Sea will be a renewed topic of interest in March.
_______________________________________________________
| 2/16/2018 | 2/23/2018 | chg | |
| UST 2Y | 222.0 | 223.8 | 1.8 |
| UST 5Y | 263.2 | 261.7 | -1.5 |
| UST 10Y | 287.5 | 287.0 | -0.5 |
| UST 30Y | 313.5 | 315.7 | 2.2 |
| GERM 2Y | -56.8 | -53.5 | 3.3 |
| GERM 10Y | 70.6 | 65.3 | -5.3 |
| JPN 30Y | 78.5 | 75.0 | -3.5 |
| EURO$ H8/H9 | 51.0 | 48.5 | -2.5 |
| EURO$ H9/H0 | 27.0 | 27.0 | 0.0 |
| EUR | 124.09 | 122.98 | -1.11 |
| CRUDE (1st cont) | 61.55 | 63.55 | 2.00 |
| SPX | 2732.22 | 2747.30 | 15.08 |
| VIX | 19.46 | 16.49 | -2.97 |
GUNDLACH INTERVIEW: …HERE’S THE DEAL: WHEN THE NEXT RECESSION COMES, IT’S REALLY GOING BE INTERESTING BECAUSE WE’RE ALREADY PUTTING ON A 1.2, 1.3 TRILLION DOLLAR DEFICIT IN FISCAL ’19, AND WE HAVE QUANTITATIVE TIGHTENING GOING ON, WHICH COULD BE AS MUCH AS 600 BILLION IN FISCAL ’19, WE’RE TALKING ABOUT NEARLY 2 TRILLION OF GOVERNMENT BONDS AND CORPORATE BONDS AND JUNK BONDS, AND BANK LOANS STARTING TO SHOW SOME REAL MATURITIES, SO YOU PUT A RECESSION ON TOP OF THAT, YOU CAN BE LOOKING AT BOND SUPPLY LIKE WE HAVE NEVER SEEN BEFORE. AND SO THE REAL QUESTION, AND THIS IS SOMETHING WE’RE NOODLING WITH AT DOUBLELINE, AND WE’RE GONNA LET SOME OF THE DEVELOPMENTS FORM OUR POINT OF VIEW, NOW WE DON’T HAVE A PRESET POINT OF VIEW, ALWAYS BETTER TO KEEP AN OPEN MIND, BUT WILL THE NEXT RECESSION BE BOND FRIENDLY WITH ALL OF THAT SUPPLY COMING? IT’S REALLY AN INTERESTING QUESTION FOR INVESTORS TO PONDER. WE DON’T HAVE TO ANSWER THAT TODAY, BECAUSE THE RECESSION ISN’T HERE YET.
https://www.cnbc.com/2018/02/23/cnbc-exclusive-cnbc-transcript-doubleline-capital-ceo-jeffrey-gundlach-speaks-with-scott-wapner-today.html
Feb 23. An – B A N G ! !
–BIG story this morning is China’s takeover of Anbang Insurance Group. (A couple of BBG links at bottom). There have been many stories about China taking steps to deal with bad debt and malinvestment, and this is a HUGE concrete example. What happens when debts become unwieldy and debt service costs are met by piling on more debt? Assets are sold. Liquidated. I have no idea how much this will ultimately reverberate through the markets, but it comes on the heels of HNA, another large Chinese company, saying it would sell $4B in US assets as the financing noose tightens. At the margin, this means tighter credit conditions, certainly in China but likely everywhere. It probably also means a tilt towards protectionism, which could feed into inflation. I don’t know how many times I’ve read that China has a huge debt problem, but that the state was big enough to deal with it. We’ll find out now. My bet is that it’ll turn messy.
–Not many people were familiar with AIG until the US financial crisis. Same with Anbang. Is this China getting in front of the problem? Or is it the first step in a deluge of asset sales. When ‘assets’ aren’t covering debt service costs and are put on the selling block, it often comes as a shock how little they are actually worth. This is bad for China’s growth, and likely a negative for global growth.
–My first inclination is to buy short dated treasuries; look for the curve to steepen. In the near term it should throw questions on the idea of constant Fed hikes. Is this why someone bought 50k FFJ the other day at 9834.5/35? Does this news account for the relative strength in the front end yesterday? As of this writing it doesn’t seem to have much of an impact on US stocks or bonds (ESH 2717 and TYH 120-16). March treasury options expire today, and I would certainly look to buy some high gamma treasury calls. While the March Fed hike might not be derailed, June comes into question. This is BAD for risk.
–In terms of yesterday’s action, yields fell a bit as the treasury concluded the 7 year auction. I obviously think some of yesterday’s buying was from those in the know about today’s news. Eurodollar strip was +3 to +4.5 across the strip. FF/ED spreads came in a couple of bps, for example, EDM8/FFN8 settled 40 vs a high close of 42 on Wed. EDZ8/FFF9 closed -3 at 37.5, retreating from the high of the move set Wednesday of 40.5. Though a decent amount of trades went through, I will note buying of EDZ9 9800 and 9825 calls (paid 10 in strip vs 9712 in 20k and paid 4 for another 15k of 9825 vs 9714). These buys appear to be covers, but I will once again note that EDZ9 open interest is most on the board at just under 2 million, was up 50k yesterday.
https://www.bloomberg.com/news/articles/2018-02-23/china-regulators-to-take-control-of-anbang-insurance-for-1-year-jdz9l5fp
https://www.bloomberg.com/news/articles/2018-02-23/xi-s-debt-crackdown-goes-into-hyperdrive-with-anbang-takeover
CDX Investment Grade… financing conditions are going to tighten.
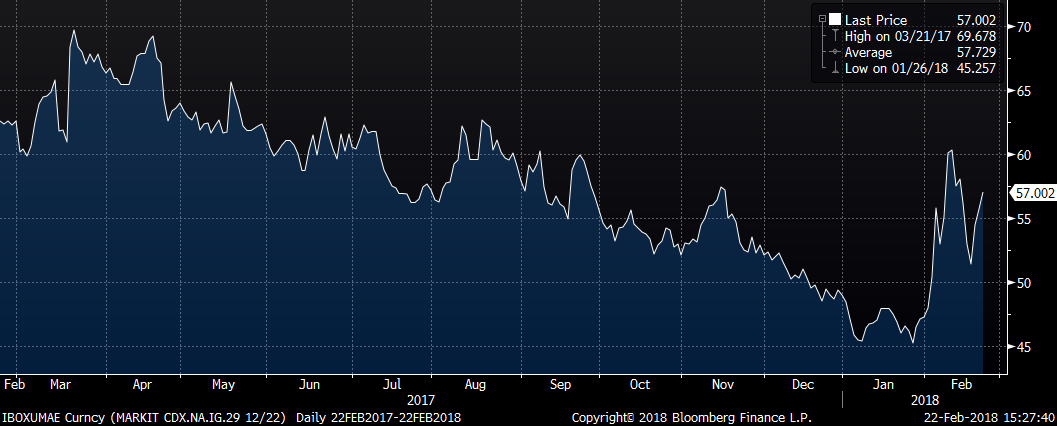
Feb 22. Yields are going the way of lumber : higher
–New high yields across the curve yesterday. Ten year yield rose 4.8 bps to 293.9. At futures settlement I marked the bond at 322.1, essentially right at the high yield mark of last year in March. Curve was marginally steeper; red/gold pack spread gained 0.625 bp. On the dollar curve there were new high settlements made in a couple of one-year spreads, but interestingly they are slightly further back; EDU8/U9 settled 42.5 and EDZ8/Z9 37.0, both +2 on the day. The peak spread is still EDH8/H9 which settled 53.75 only +0.75. The extreme selling pressure on the front end of the curve is preventing near spreads from making new highs. I mentioned yesterday the idea of buying EDJ (April) 9775 straddle for 8.5 which has EDM8 as the underlying. Interesting to note that EDH8 9787^ settled 7.25. In this environment I’d pay an extra 1.5 bps for the extra 25 days…
–Heavy buy of FFJ8 at 9834.5 to 9835.0. Feb is 9858.25, so an avg price of 9834.75 is a spread of 23.5… it appears someone is paying 1.5 bps of protection against a stock crash that might take a March hike off the table. Open int in the April contract +44k. If FFG8 is 9858.25, then TWO hikes by June would indicate 9808.25 and July FF settled 9814.5. So the market is getting pretty comfortable with 2 hikes in H1, while a spread like EDM8/EDZ8 only trades 26, and July/Jan FF 27.5. So only 1 hike for H2?
–Off topic perhaps, but March Lumber closed at new record highs, 526.0. This contract has surged from 410 to 526 since December, up 28%. I’m sure there are specific reasons (perhaps it has to do with trade policies, which seem a bit more fluid these days), but in the big picture, price surges may not be so uncommon anymore.
–Late in the day there was a buyer of about 25k 3EH 9700p for 10 ref EDH21 9697.5. The straddle, which settled 16.5, went to a solid 17.5 bid. I would note that the underlying contract traded 9705 just after the FOMC minutes and fell 8 bps into the end of the day. Vol in general has been muted over the past week, but the market is becoming a lot looser. Treasuries are getting toward target or resistance levels; as mentioned above bonds equaled last year’s high yield and tens are nearing 3%. This morning treasuries have rebounded slightly….however, that’s no reason to sell vol in my opinion.
–News today includes Leading Indicators expected +0.6. Dudley speaks. 7 year auction.
Feb 21. Five year. Auction and calls
–Curve flattened Tuesday as the treasury auctioned 2 year notes. Red and green eurodollars were weakest contracts on the board, -3.625 and -3.75. Tens rose 1.6 bps to 289.1. Good size buying in EDH9 9700p for 3.5 in size about 50k (OI +34k, EDH9 settled 9741.5 and puts at 3.25). There were a few other trades which accentuated weakness in reds; fairly obvious from price action.
–The minutes will be scrutinized for clues of four hikes this year. There was a slight language change in the last statement that called for “further” gradual adjustments to rates. I’m guessing that means…’further gradual adjustments’, but to some people it means “four”.
–Apart from the FOMC minutes, 5 year notes are auctioned today, followed by 7’s tomorrow. Philly Fed’s Harker speaks on the Economic Outlook at 9:00.
Feb 18. Veisalgia – ‘Uneasiness following debauchery’
My web surfing research was freewheeling for this note. First, I thought I would delve into the Chinese New Year, Year of the Dog. Somehow, this morphed into Hair of the Dog, which turned out to be a much more productive and useful thread of inquiry, and led to this week’s title, “Veisalgia” which was apparently coined as a medical term in the year 2000 to describe a hangover. This scientific word is formed from Norwegian ‘kveis’ (uneasiness after debauchery) and Greek ‘algia’ (pain). I don’t know why some pompous jackass had to come up with a ‘medical name’ for a hangover, but I knew I was going to use it when one site also referenced Vikings.
In any case, the term sort of fits with market action last week, subsequent to the Viking debauchery of vix, stocks and bonds in the previous week. This week stocks rallied, the dollar had a small bounce, vix fell. It all feels a little better. On the trading floor after a big night it would be comparable to working through the 7:30 data, followed by a trip to the Merc Club, and an omelet made by Carmen with her homemade salsa, served by the charming Idolina, while Onecimo or Alfredo set you up with a 7 oz Budweiser (or two), all the while with a view through the west windows of office workers streaming out of the Northwestern train station for their day’s 9 o’clock start. Hair of the dog, all better. The business was a bit more fun back then. So…let’s try to recall some details from last week.
The big piece of data was CPI, which came out stronger than expected at +0.5. Yields surged to new highs. However, the curve flattened, and sensing the worst of the damage was over, vol on longer maturities was crushed going into the holiday weekend. I marked the USM straddle at just 8.2 vol, astonishingly low in my opinion. On the week, 5/30 dropped over 11 bps, from 62.3 to 51.1.
On Friday, the dollar index posted a slight new low, but then reversed with an outside day and closed higher. EURUSD was a mirror image, new high and a reversal. Everyone has now become a dollar bear, but I think it’s due for a good tradable bounce with more or less of a triple bottom set Jan 26, and then Jan 31, followed by Friday’s test which was slightly lower. Stop out below Friday’s low, or above Friday’s high if shorting EUR.
What I keep reading now are references to old topics that have had new life breathed into them: twin deficits, crowding out, trade wars. So I used google trends on the first two phrases, expecting to see a surge in interest. I didn’t. But even though they’re not on google, doesn’t mean they haven’t crept back into the markets’ consciousness.
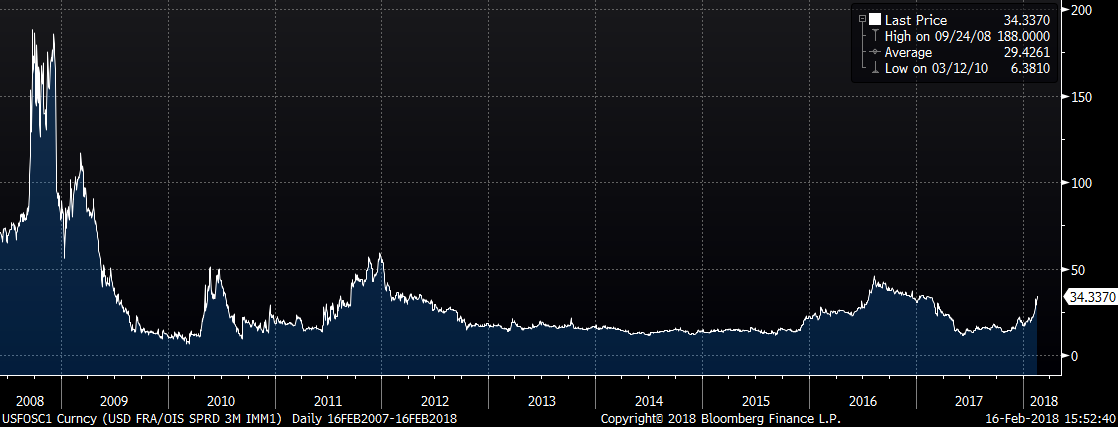
The big issues for fixed income remain, and are quite clear. Increased supply in the context of increased inflation. While the BoJ re-affirms its monetary stimulus with Kuroda’s reappointment and a new deputy who favors more monetary largesse, elsewhere things are tightening up just a little. This is obvious in the front end of the Eurodollar curve, where both EDH8 and EDM8 settled at new lows. The fall has been stunning. EDM8 has surged over 75 bps in yield since September, from 9852.5 to Friday’s settle of 9777.5. Friday to Friday change in EDH8 was 9804.5 to 9795.5 and in EDM9 9786.0 to 9777.5. In contrast, the ten year note yield rose just under 5 bps on the week to 287.5 and the 30 yr bond was essentially unchanged at 313.5. By the way, weakest parts of the curve were the 2y (+13 bps) and red euro$ pack, -14.875. Here’s a picture of fra/ois…looks like it wants to revisit highs made during the money market reform surge to nearly 50 bps in October of 2016.
In terms of ‘crowding out’ I would note that HYG spiked to a new low on Friday 09-Feb, but has been grinding higher over the past week. I would mention once again, that corporate debt at $8.84T and total business debt at $14.06T are at record levels….not such a big deal given low rates and tight spreads, but debt servicing costs are going to chew up a bigger part of the budget going forward, for both gov’t and business, and with gov’t debt becoming more plentiful, the business sector may need to pay more of a premium for financing.
On the topic of trade wars, Commerce Sec’y Wilbur Ross suggested imposing hefty tariffs on steel and aluminum for national security purposes. Trump has until April to decide, but China has already responded, and I wouldn’t be surprised if the threat of trimming reserves of US treasuries isn’t inferred as a possible response.
The point is, we’ve addressed the worst part of the hangover with a big greasy breakfast and hair of the dog, but now the market may be rested well enough for another foray into debauchery. Like Vikings.
****************************
This next section is redundant for some, as I put out a note late Friday regarding EDZ8 and EDZ9 positioning. However, I am repeating some of the highlights here with updates.
There has been heavy accumulation of EDZ8/EDZ9 calendar spreads since the start of the year, including a block buy of 40k at 34.5 on Friday. According to CME data, open interest in EDZ9 vaulted up by 93k contracts Friday to 1.822m, which is now the highest open interest on the curve, followed by EDZ8 at 1.750m (down by 21k Friday). The next highest contract is EDM8 with 1.54m, so people are extrapolating position size of 400+k for the Z8/Z9 buyer. I’ve previously noted Fed ‘dot’ projections for Fed Funds at year end of 2018 and 2019 at 2.1% and 2.7%, and with EDZ8 settling at 9753.5 or 2.465% and EDZ9 settling at 9719.5, or 2.805%, the market is pretty much accepting the Fed’s forecast (for the first time ever).
As a reminder, on January 5, there was a seller of >100k EDZ8/Z9/Z0 butterfly at 14.5. On that day, EDZ8/9 settled 20 and EDZ9/0 at 5.5. Over the next couple of days the low in the fly was 13, but on Friday it settled at a new high for the year at 24.0, and traded as high as 25.5. In the interim, associated with the Feb 5 stock sell off, the fly touched 14.5 again. On Friday, EDZ8/9 settled 34.0 and EDZ9/0 10.0.
There’s obviously a pretty good roll up the curve. For example, EDH8/9 is 51.0, M8/M9 43.0, U8/U9 39.0. However, the forward roll has become slightly less compelling recently, especially as fra/ois spread has blown out and near contracts came under heavy selling pressure. For example, the high settle on 2-Feb in EDH8/EDH9 was 60.5, and it’s now 51.0. EDZ8/EDZ9 on 2-Feb was 36.0s. So, at that point, the roll was 60.5-36.0 or 24.5 bps; call it 2.7 bps per month. But now that’s been cut back to a difference of 51 vs 34, or 17 bps over 9 months; 1.9 per month. This is obviously simplistic, but provides a bit of context. On 2-Feb the one year butterflies were as follow: March 29.5, June 24.5, Sept 24.0 and Dec 22.0. Now they are 24.0, 24.0, 25.0 and 24.0.
In a more technical picture, the weakness of EDZ9 is ‘distorting’ markets. For example, consider EDM9/EDU9/EDZ9 fly vs EDU9/EDZ9/EDH0 fly (3 month double butterfly). It traded -7.0 Friday. The doubles on either side are +4.0 (EDH9 start) and +6.0 (EDU9 start). That’s quite a disparity, and indicates “cheapness” of EDZ9 contract. Or consider plain 6 month butterflies: EDM9/EDZ9/EDM0 is 11.0/11.5 (11.0s). The one in front, EDH9/EDU9/EDH0 is 7.0 and the one after, EDU8/EDH9/EDU0 is 6.0.
There are sev’l reasons that this situation might persist, (or might not). First, perhaps the EDZ8/Z9 buyer begins to exit. That doesn’t appear so likely. Second, rel val players could come in and start buying EDZ9 in various fly configurations, which might rub the rough edge off of this curve ‘kink’. That obviously is occurring, but may not be large enough to have much impact yet. However, given the decline in front butterflies, players might be more emboldened to fade Z9 weakness. For example, selling Z/Z/Z no longer appears to entail much in the way of negative carry.
_______________________________________________________
| 2/9/2017 | 2/16/2018 | chg | |
| UST 2Y | 205.7 | 218.7 | 13.0 |
| UST 5Y | 251.3 | 262.4 | 11.1 |
| UST 10Y | 282.6 | 287.5 | 4.9 |
| UST 30Y | 313.3 | 313.5 | 0.2 |
| GERM 2Y | -56.7 | -56.8 | -0.1 |
| GERM 10Y | 74.5 | 70.6 | -3.9 |
| JPN 30Y | 80.5 | 78.5 | -2.0 |
| EURO$ H8/H9 | 46.0 | 51.0 | 5.0 |
| EURO$ H9/H0 | 26.0 | 27.0 | 1.0 |
| EUR | 122.52 | 124.09 | 1.57 |
| CRUDE (1st cont) | 58.99 | 61.55 | 2.56 |
| SPX | 2619.55 | 2732.22 | 112.67 |
| VIX | 29.06 | 19.46 | -9.60 |
https://en.wiktionary.org/wiki/veisalgia
https://www.waywordradio.org/veisalgia/
Feb 16. Volatility deflates as curve flattens and dollar falls
–Curve flattened and long end vol was crushed on Thursday. April 10y vol back at just 4.5. There were some large put trades on near contracts, exit seller of at least 75k EDU8 9800/9775ps at 20..5, but a buyer of EDM 9775/9762ps, 3.25 for at least 40k, and buying of 0EM 9725/9700ps for 3.5 in 30k during the day. EDH8 settled at a new low of 9797.5; a couple of weeks ago the atm EDH8 9812 straddle was sold at 3.75 which is now 15 intrinsically, and yet somehow people feel comfortable selling EDM8 9775^ at 13.0 with 123 days until expiration.
–Stocks rebounded, VIX back below 20. It’s all getting back to “normal”. Kuroda got another stint as the head of the BOF, with the added monetary turbo-boost of deputy Wakatabe, who advocates more aggressive easing. It would be like handing the keys of the Fed to Kocherlakota. On the other hand, $/yen fell; it hasn’t been this weak since we were afraid Hillary was going to be elected. USD looking ever more vulnerable to a crash which should continue to underpin higher inflationary expectations.
–Market trades as if nothing can deter the Fed from near term ‘normalization’ but longer term growth and inflation will falter. 5/30 was over 62 on Friday, but closed just below 51 yesterday. Feb midcurves expire today in euro$’s.
Feb 15. End of Day…Fixed Income Vol Hammered
Treasury vol hammered Thursday, Feb 15. Most of the inflation news was already released this week (Wed CPI was the big one) and the curve flattened. 5/30 was 61.5 last Friday and 51 late Thursday.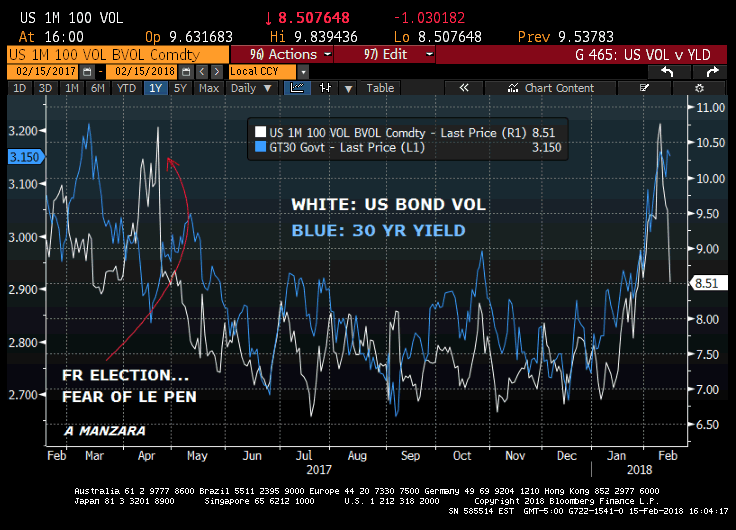
Feb 15, 2018. The Zimbabwe Rally
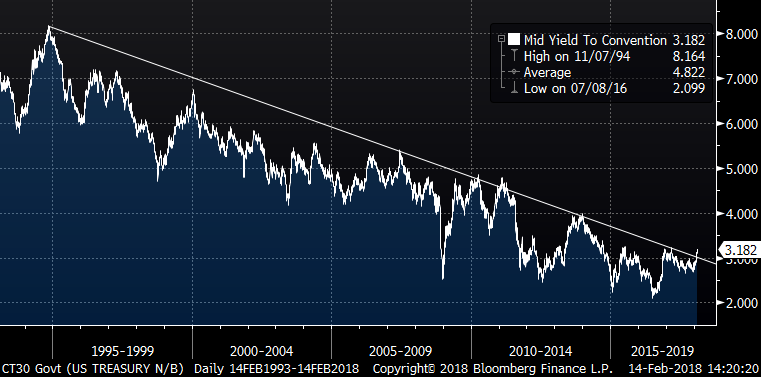
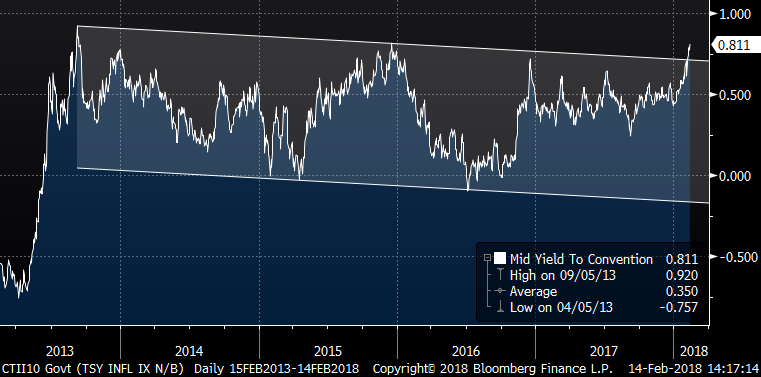
–Huge day in fixed income as inflation concerns jumped with yesterday’s 0.5 print on CPI. Core yoy was +1.8 and Retail Sales were a bit soft (-0.3 vs +0.2 expected), but the remaining piece of the rate rise puzzle had been price acceleration, and this data, along with the 2.9% yoy increase in Avg Hourly Earnings in the employment report was enough to provide a tipping point. The ten year yield rose 7.4 bps to 291 (and was higher after the floor close). Fives surged 9.7 bps to 264. The green euro$ pack was weakest on the dollar curve, down 10.625 bps. All treasury yields posted new highs. At the 2pm floor close, TYH was 120-105 with ten-yr 290.9. With DV01 of 74.70 that puts 3% at approx 22/32s lower or 119-205. In USH, the settle was 142-12 vs 317.2. The high closing yield mark of 321.3 in 2017 is thus approx. 24/32’s away or 141-20. (Charts below indicate breakout in 30 yr yield, and a possible confirmation breakout in the ‘real’ ten year yield, the inflation indexed note).
–Surprisingly, stocks ramped up on the day after a brief spike lower on the data. No good reason for this except for the decline in USD (I refer to Zimbabwe because stocks there exploded higher as a store of value when the currency evaporated). Stocks are higher again this morning with a weaker dollar; once again there are references to ‘twin deficits’ in the US. I defer to Paul Tudor Jones: “It is incredible that at full employment we have passed a tax cut that will push our deficit to 5% of GDP. Can you imagine what will happen to the deficit and debt in the inevitable downturn? This is what the dollar is sensing.”
–Huge buyer of EDU8 9762/9750ps for 4-4.5, >150k. EDZ9 fell 11 bps and (according to prelims) open interest surged 108k. EDZ8 and Z9 have the most open interest of any contracts, Z8 1.744m (+11k) and Z9 1.678m (+108k).
–News today includes Job Claims, PPI expected +0.4 with Core +0.2, Philly Fed 21.0, Ind Prod +0.2.
–Interesting article by Ambrose Evans-Pritchard yesterday: The Fed Can’t Legally Save the World Financial System in Another ‘Lehman’ Crisis
The Dodd-Frank Act, rushed through in a pageant of self-congratulation in 2010, prevents the Fed from rescuing individual companies in trouble (there must be at least five, and they must be solvent) or lending to non-banks in a panic. It can lend only to “insured depository institutions” through its discount window with the Treasury’s permission. Fed chieftains Ben Bernanke and Don Kohn warned that these curbs were extremely ill-advised. They were ignored…
30 year tentative breakout and 10y tip yield